
SEL-5703 Synchrowave Monitoring
Real-Time and Historic Trending and Archiving
Improve understanding of system events and expedite root cause analysis with high-resolution time-series data. Synchrowave Monitoring receives and analyzes synchrophasor data, continuous waveform streams, and event reports to provide power quality monitoring and disturbance analysis.
Synchrowave Software Comparison Chart
Budgetary Retail
Trending and Archiving Application Package for 25 Streaming Devices: $13,700 USD
Disturbance Monitoring—Analyze synchrophasor, continuous waveform, and event report data for a complete disturbance monitoring solution. Easily find system disturbances, and export data to CSV and COMTRADE data formats for NERC PRC-002-2, PRC-0028-1, and IEEE 2800 compliance. Combine Synchrowave Monitoring with SEL-5705 Synchrowave Reports software to generate automated IEEE 519 harmonic compliance reports.
Real-Time System Visibility—Improve system visibility by viewing live, subsecond, and time-aligned information from across the entire power system. Gain additional insight into the dynamic behavior of the power system through waveform signatures to aid in analysis during abnormal conditions.
Power System Model Validation—Record the system response to generator trips, load shedding, remedial action scheme (RAS) operations, and other events. Analyze the archived system responses, and compare them to power system models. Simply export system response data from Synchrowave Monitoring to external power system simulation and modeling applications.
Renewable Energy Monitoring—Gain perspective on how increasing renewable energy sources impact system stability. Dynamics from low-inertia generation sources change quickly—too fast to see at traditional SCADA rates. High-resolution measurements in Synchrowave Monitoring detect and track the impact renewables have on power quality metrics, including subsynchronous oscillation (SSO), rapid voltage change (RVC), and harmonic distortion.
Continuous Waveform Recording and Analysis—Never miss an event again. A growing line of SEL hardware provides continuous waveform streams in real time, including the SEL-2240 Axion, SEL Real-Time Automation Controller (RTAC), SEL-735 Power Quality and Revenue Meter, and soon-to-release SEL-T35 Time-Domain Power Monitor. Sampling and streaming rates range from 3 kilosamples per second (ksps) to 14.4 ksps. Synchrowave Monitoring software receives these data streams, provides real-time metering values, trends these values, provides real-time alarms, and archives the data.
Virtual Metering—View and customize a suite of power monitoring quantities. Virtual metering calculations utilize the 3.0–14.4 ksps data streams to provide power metering quantities, including voltage, current, power, frequency, symmetrical components, and power factor. Additional power quality quantities include harmonics; RVC; voltage sag, swell, and interruption (VSSI); and flicker. The virtual metering application also calculates PMU quantities with the continuous waveform data.

Features
-
- 1
Trending
Compare real-time and historical trends.
- 2
Relay Events
Correlate relay event records to the system response. Select the event report to see the relay oscillography.
- 3
Phasor Scope
Visualize phase angle separation between measurements to determine system stress.
- 4
Timeline
Use the timeline to seamlessly transition between real-time and historical data.
1234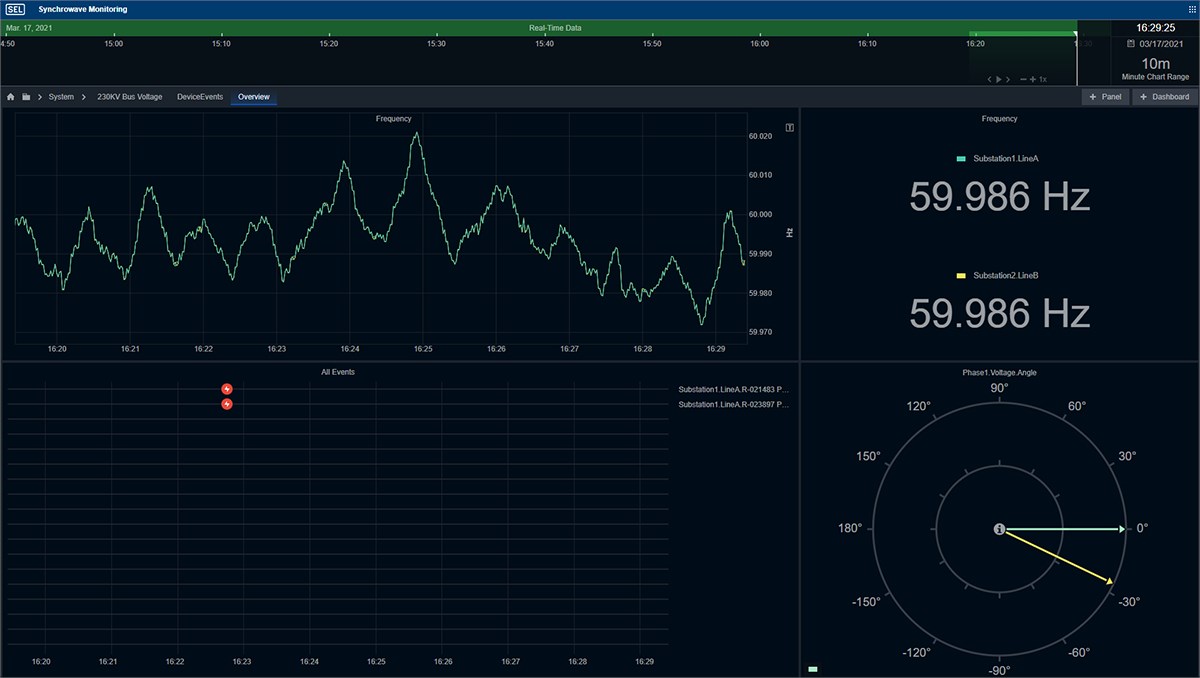
-
-
- 1
Event Summary
Event report summary information.
- 2
Oscillography
Trending of relay oscillography.
- 3
Digitals
Status of relay word bit state with respect to time.
- 4
Relay Settings
See the state of relay settings at the time of the event report trigger.
1234
-
-
- 1
High-Resolution Data
Visualize waveforms at 3.0–14.4 ksps to capture fast transients and high-frequency disturbances.
- 2
Enhanced Power Quality Monitoring
More detailed monitoring of disturbances and abnormal conditions helps engineers and operators proactively maintain grid reliability and stability.
12.png?n=63877561752000)
-
-
- 1
Alarms and Alerts
Receive notifications of any issues or anomalies present in the power system. Configure custom warning and alert thresholds to quickly address issues.
- 2
Oscillation Detection
Real-time monitoring helps operators immediately recognize oscillatory conditions and respond to potentially abnormal power system conditions.
- 3
Disturbance Detection
By continuously observing the power system, operators can quickly identify any deviations from normal conditions and take corrective action to maintain grid reliability and stability.
- 4
Calculations
Define and execute user-defined calculations on continuous waveform and phasor measurement unit (PMU) measurements.
- 5
Power System Modeling
Associate signal measurements with power equipment. Use GIS data and nominal voltages to connect stations, buses, and lines for monitoring and analysis.
12345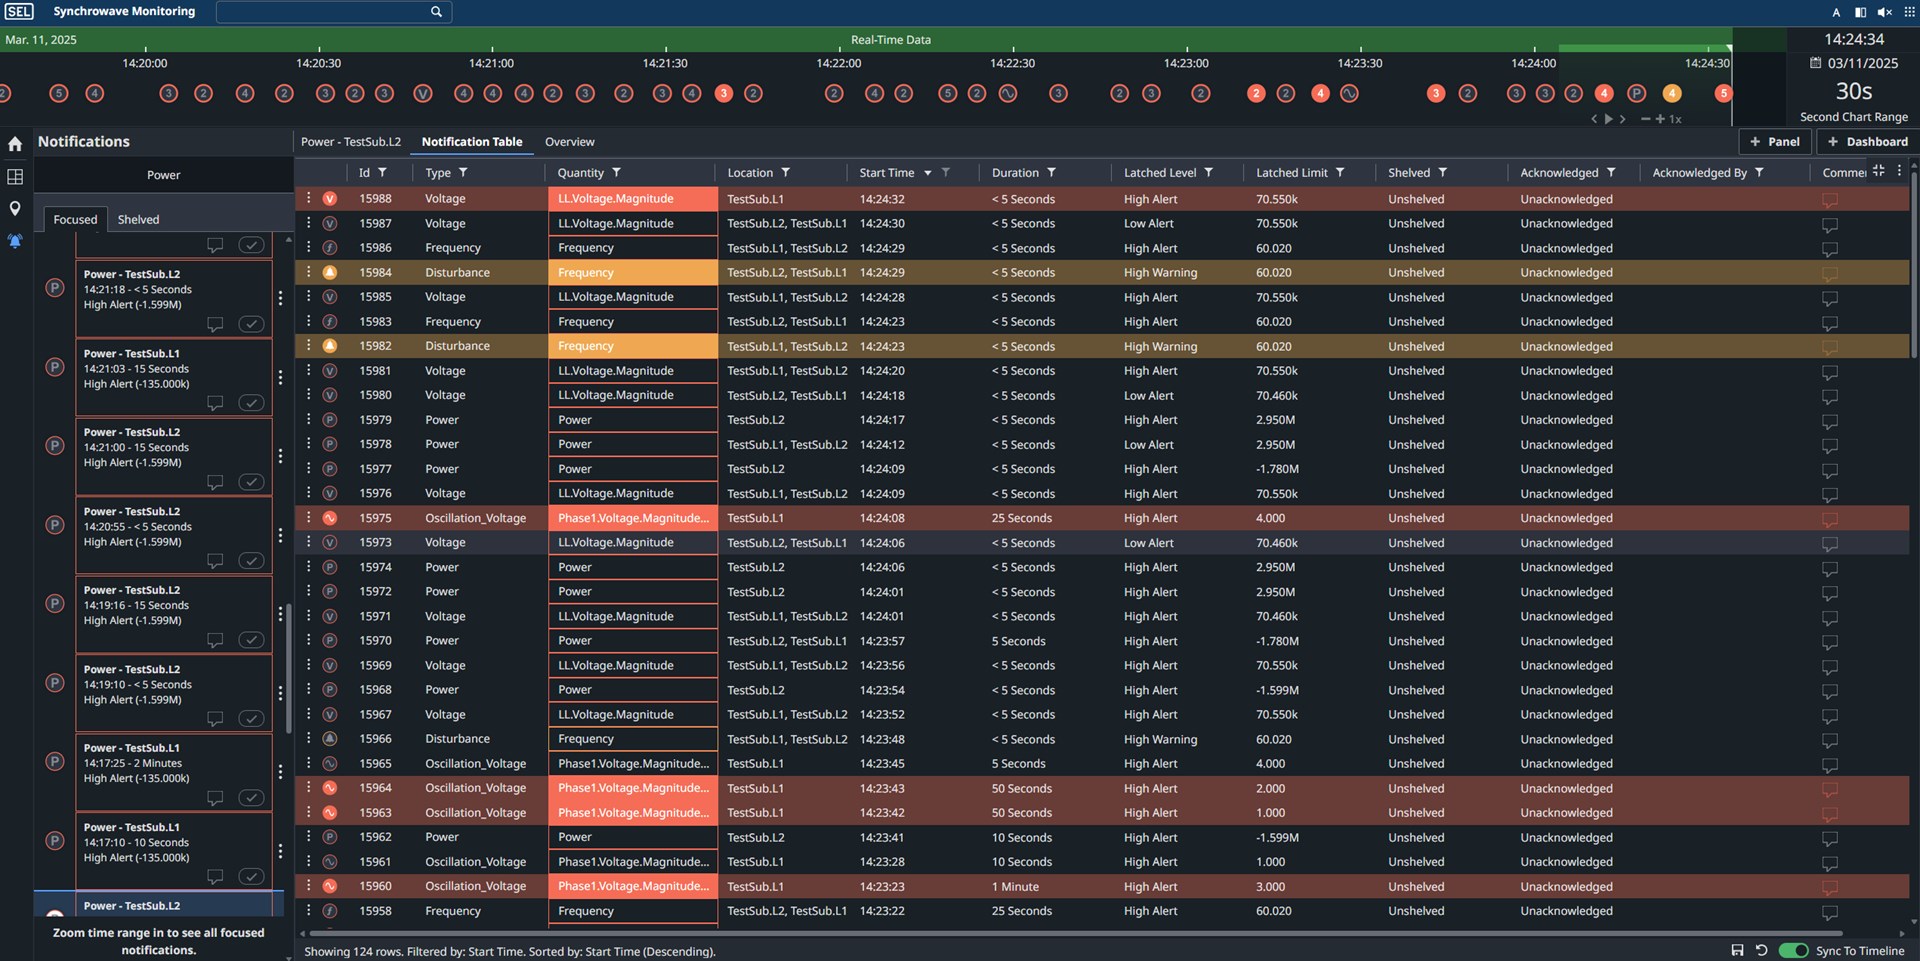
-
Details
Synchrowave Monitoring—Trending and Archiving Application Package
The Trending and Archiving package includes the following applications:
- Timeline—Displays real-time and historical data within Synchrowave Monitoring.
- Dashboards—Provides real-time visualization of power system data and information across multiple panels.
- Panels—Includes basic streaming data visualization and analysis panels:
- Time-Series Trend
- Numeric Meter
- Phasor Scope
- Digital Chart—Provides visualization of digital signals at various time scales.
- Device Events Panel—Lists a summary of event reports that are stored in the acSELerator Database.
- Sequence, Power, and Custom Calculations—Defines and executes user calculations on streaming power system data.
- Synchrowave Event Express—Enables web client visualization of relay event reports archived in the acSELerator Database or Blueframe Device Management and Automation (DMA) software.
- Virtual Metering—Provides monitoring of metering data through the Synchrowave Platform.
- acSELerator Database Reader—Connects Synchrowave Monitoring to the event reports stored in the acSELerator Database. acSELerator Team SEL-5045 Software or DMA software automate event report collection from SEL devices, meters, and controllers.
- acSELerator Database Receiver—Connects Synchrowave Monitoring to the event reports stored in the acSELerator Database or DMA software.
- IEEE C37.118 Reader—Reads from IEEE C37.118 synchrophasor streams to display and archive measured signals.
- CWS Receiver—Provides monitoring of 3 ksps signals.
- Historian—Archives synchrophasor data within a programmed retention period.
- Data Indexer—Creates indices of historian data, enabling fast data access.
- Data Export—Downloads selected data directly from the web client display in CSV or COMTRADE format.
- Web Gateway—Provides HTTPS configuration and authentication via Lightweight Directory Access Protocol (LDAP)-based Microsoft Active Directory.
Synchrowave Monitoring—Power Monitoring Application Package
The Power Monitoring package includes the following features and applications:
- All the features from the Trending and Archiving application package.
- Advanced data visualization and analysis panels:
- Bar Chart
- Dial
- Table
- XY Chart
- Histogram
- Oscillation and Disturbance Detection—Identifies unusual disturbances on the power system.
- Power System Model—Associates signals with physical power system equipment.
- Notifications and Alarms—Notifies operators and engineers of new conditions on the power system.
Synchrowave Platform
Synchrowave Monitoring includes a Microsoft Windows-based version of the Synchrowave Platform.
- The platform supports installation for one server.
- Synchrowave Platform applications run as Windows Services. Applications are packaged together into the Windows Installer. Updating applications individually is not supported in Synchrowave Monitoring. Installing the latest Windows installer will update all applications in the platform.
Synchrophasor Recording System Requirements
- Windows OS (Windows 10 Enterprise, Windows 11, Windows Server 2016, Windows Server 2019, or Windows Server 2022 Standard)
- Local storage (preferred) or high-performance network drive. Storage requirements depend on number of phasor measurement units (PMUs), number of signals per PMU, and data rate. (125 GB per PMU per year at 60 messages per second is often used for approximate storage estimates.)
Continuous Recording System Requirements
- Windows OS (Windows 10 Enterprise, Windows 11, Windows Server 2016, Windows Server 2019, or Windows Server 2022 Standard)
- Local storage preferred. Storage requirements depend on the number of waveform measurement devices, number of channels, and streaming rate, as exemplified below.
| Model | Sample rate | Channels | Network bandwidth (Mbps) | Storage (GB per day) |
|---|---|---|---|---|
| SEL-735 Power Quality and Revenue Meter | 3 ksps | 6 | 1 | 6 |
| SEL-2240 Axion | 3 ksps | 96 | 11 | 100 |
| SEL-T35 Time-Domain Power Monitor | 14.4 ksps | 17 | 11 | 85 |
Videos
.jpg?n=63791944811000&preset=size-col-10&bp=lg)
.jpg?n=63791944977000&preset=size-col-10&bp=lg)
.jpg?n=63791945134000&preset=size-col-10&bp=lg)


The Firmware IDs for older versions of the firmware can typically be found in Appendix A of the instruction manual.
Instruction Manuals
Sales Resource Central access is required to view the content in this tab.
Sales Resource CentralSynchrowave Monitoring is composed of a suite of applications running on the Synchrowave Platform. The applications included in the Trending and Archiving application package and the Power Monitoring application package are described below.
| Synchrowave Monitoring Applications | Trending and Archiving Application Package | Power Monitoring Application Package |
|---|---|---|
| Timeline and Dashboards | ||
| Time-Series Trend, Numeric Meter, and Phasor Scope Panels | ||
| Synchrowave Event Express, Device Events Timeline, and acSELerator Database Reader | ||
| Virtual Metering | ||
| IEEE C37.118 Reader and CWS Receiver | ||
| Time-Series Historian, Data Indexer, and Data Export | ||
| Role-Based Access and Web Gateway | ||
| Calculation Engine | ||
| Advanced Data Visualization and Analysis Panels | ||
| Power System Model | ||
| Notification and Alarms |
Licensing for each Synchrowave Monitoring application package is based on the number of streaming devices. To receive a quote for your system, contact your local SEL sales representative.
5703 - Software Tab
Supporting Software
SEL Device Management and Automation (DMA) Application Suite
Available on the Blueframe platform, SEL DMA applications automatically collect, store, and manage device-specific information like oscillography, Sequence of Events (SOE) data, device settings, and property information as well as providing automated password rotation and streamlined device audits.
Learn more on the DMA software page.
SEL Compass
Compass provides simple and convenient tools for managing SEL digital content. Users can keep software applications and relay configuration drivers up to date without manually browsing product webpages as well as download new product updates and literature.
Learn more and download on the Compass software page.
Related Software
SEL-5702 Synchrowave Operations
Synchrowave Operations software complements SCADA and energy management systems by aggregating high-resolution time-series data, including synchrophasor data, relay event reports, point-on-wave data, and GIS geospatial data.
Learn more and download on the Synchrowave Operations software page.