SEL-5705 Synchrowave Reports
Automated Meter Data and Power Quality Reporting Software
Visualize high-resolution power system data and generate reports using Synchrowave Reports. This web-based software helps you better analyze, organize, and share the historical data you collect from SEL meters and other devices across your system. It supports you in making planning, operating, and accounting decisions to improve efficiency and reduce costs.Synchrowave Reports can be configured with report templates designed to support metering data analysis and power quality monitoring.Starting at $416 per deviceSynchrowave Reports can be licensed with a Meter Data option or a Power Quality option. The Meter Data option offers report types that support data analysis through tables, static graphs, and dynamic charts. The Power Quality option offers all Meter Data reports and adds IEEE 519 compliance reports. Both the Meter Data and Power Quality options can be bundled with SEL software for automated data collection.
Visualize and Analyze Power System Data
Derive more insights out of the historical data you collect from meters or other power system devices. Analyze long-term data trends or use interactive graphs to drill down and isolate events or time periods of interest. Examine data in the Synchrowave Reports web interface or export data for further analysis.
Retrieve Reports on Demand or by Email
Generate reports on demand, or have them automatically delivered to your email inbox at 15-minute, hourly, daily, weekly, or monthly intervals. Choose between PDF or CSV file formats.
Simplify Access With Web-Based Software
Access Synchrowave Reports from any location, and simplify software licensing and maintenance. Take advantage of security features that maintain data confidentiality, such as Transport Layer Security (TLS) encryption and Lightweight Directory Access Protocol (LDAP) authentication.
Optimize Your System With Meter Data Reports
Visualize and report on system-wide meter data, including voltage sag, swell, and interruption (VSSI) data; Load Data Profile (LDP) information; Sequential Events Recorder (SER) data; and water, air, gas, electricity, and steam (WAGES) consumption details. Use meter data to validate usage patterns and identify areas for improvement, such as opportunities to avoid peak demand charges by moving overlapping electric processes to off-peak hours. ITI (CBEMA) curves and detailed voltage event tables help you recognize power disturbance issues before they affect equipment.
Monitor Power Quality and Confirm Compliance
Easily monitor power quality and confirm compliance with IEEE Std 519, Standard for Harmonic Control in Electric Power Systems. Innovations in ac/dc and dc/ac power conversion have led to the growing adoption of technologies that increase harmonic distortion on distribution and transmission lines, which negatively affect neighboring loads and generation sources. With Synchrowave Reports, you can monitor a single point or an entire power system to support compliance activities and help detect distortions that cause excess heat, efficiency loss, system capacity reduction, and other issues.
System Architecture
Synchrowave Reports is compatible with the Device Management and Automation (DMA) Meter Monitoring package on SEL Blueframe and with acSELerator Team SEL-5045 Software. Access Synchrowave Reports through a web browser. Select from a list of report templates to simplify data analysis across a range of applications. Synchrowave applications retrieve information from a database for report generation, viewing, analysis, and distribution.Both Blueframe DMA and Team regularly poll SEL meters to collect and archive VSSI and LDP data. In addition, the TrendRecorder feature for the SEL Real-Time Automation Controller (RTAC) gathers LDP data from other devices, including SEL relays and third-party meters and relays. Use the RTAC TrendRecorder and DMA Meter Monitoring to collect up to 512 load profile channels in a single RTAC.Meter Data Option Overview
The Meter Data option includes reports to access and organize metering data collected by Blueframe DMA or Team. Use interactive charts and reports to quickly identify trends and opportunities for improvement and to validate usage patterns. In just a few clicks, operators can export and email reports in PDF or CSV format for easy sharing or further analysis in third-party software.Meter Data reports can be used to organize data from site-wide metering points and analyze the consumption of energy during different periods. Avoid peak demand charges and optimize schedules that move overlapping electric processes to off-peak hours. ITI (CBEMA) curves and detailed voltage event tables can indicate power disturbance issues before they affect equipment.Power Quality Option Overview
The Power Quality option offers all Meter Data reports and adds an IEEE 519 compliance report, which streamlines power quality compliance monitoring. Users can receive daily or weekly detailed reports with current and voltage harmonics up to the 50th harmonic for each metering point.Within ac power systems, the most efficient transfer of energy is with a pure sinusoidal waveform, as it only contains the fundamental frequency. Innovations in ac/dc and dc/ac power conversion have led to growing adoption of technologies that produce nonlinear distortions in power systems, such as energy-efficient LED lighting, variable-frequency drives, and power inverters. The switching nature of these devices has increased harmonic distortion on distribution and transmission lines, which negatively affects neighboring loads and generation sources. Power quality distortions result in excess heat, efficiency loss, system capacity reduction, mechanical oscillations of motors and generators, light flickering, and other issues.Software Bundling Options
The table below indicates the software and features included in the Meter Data ordering option and the Power Quality ordering option. SEL offers accompanying software to process continuous waveform streams. Learn about these additional capabilities on our expanded software bundles webpage.
1 Both Meter Data and Power Quality options are available without Blueframe DMA or Team licenses if an application already has the software available.
| Meter Data Option | Power Quality Option | |
|---|---|---|
| Blueframe DMA or Team 1 | ||
| Synchrowave Reports | Meter Data Reports | Power Quality Reports |
| Device Overview | ||
| SER | ||
| LDP | ||
| VSSI | ||
| Signals or WAGES | ||
| IEEE 519 Compliance | ||
SEL-5705 Synchrowave Reports Features
1
2
3
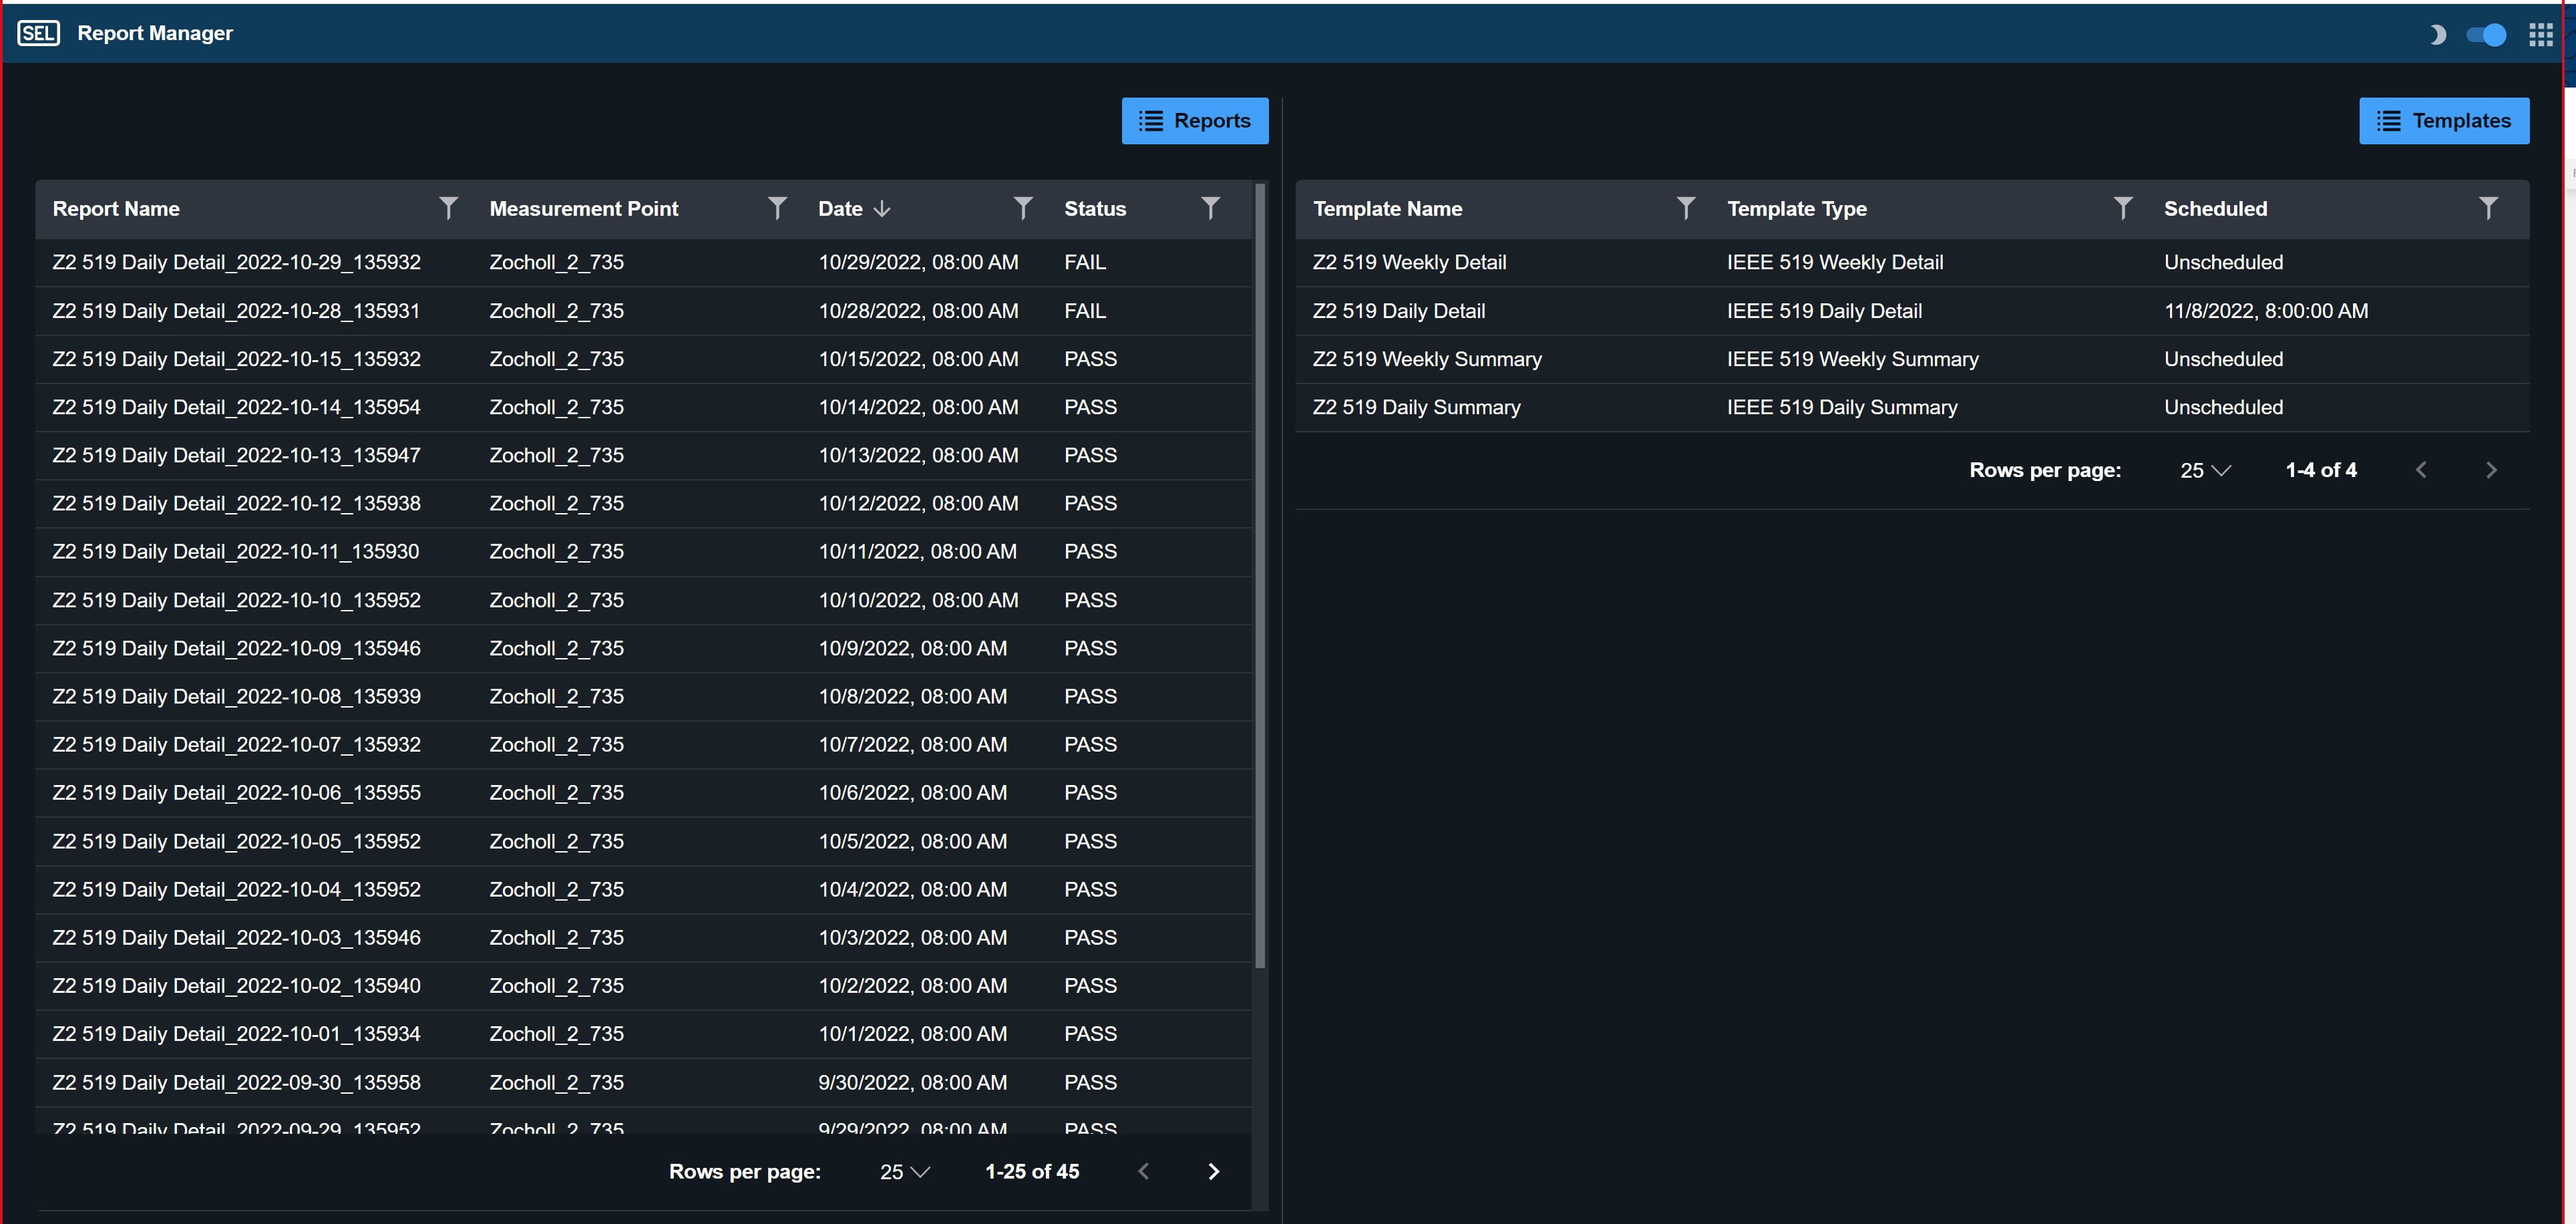
- Schedule automated report generation.
- Create new reports from existing templates.
- Access previously generated reports on demand.
1
2
3
4
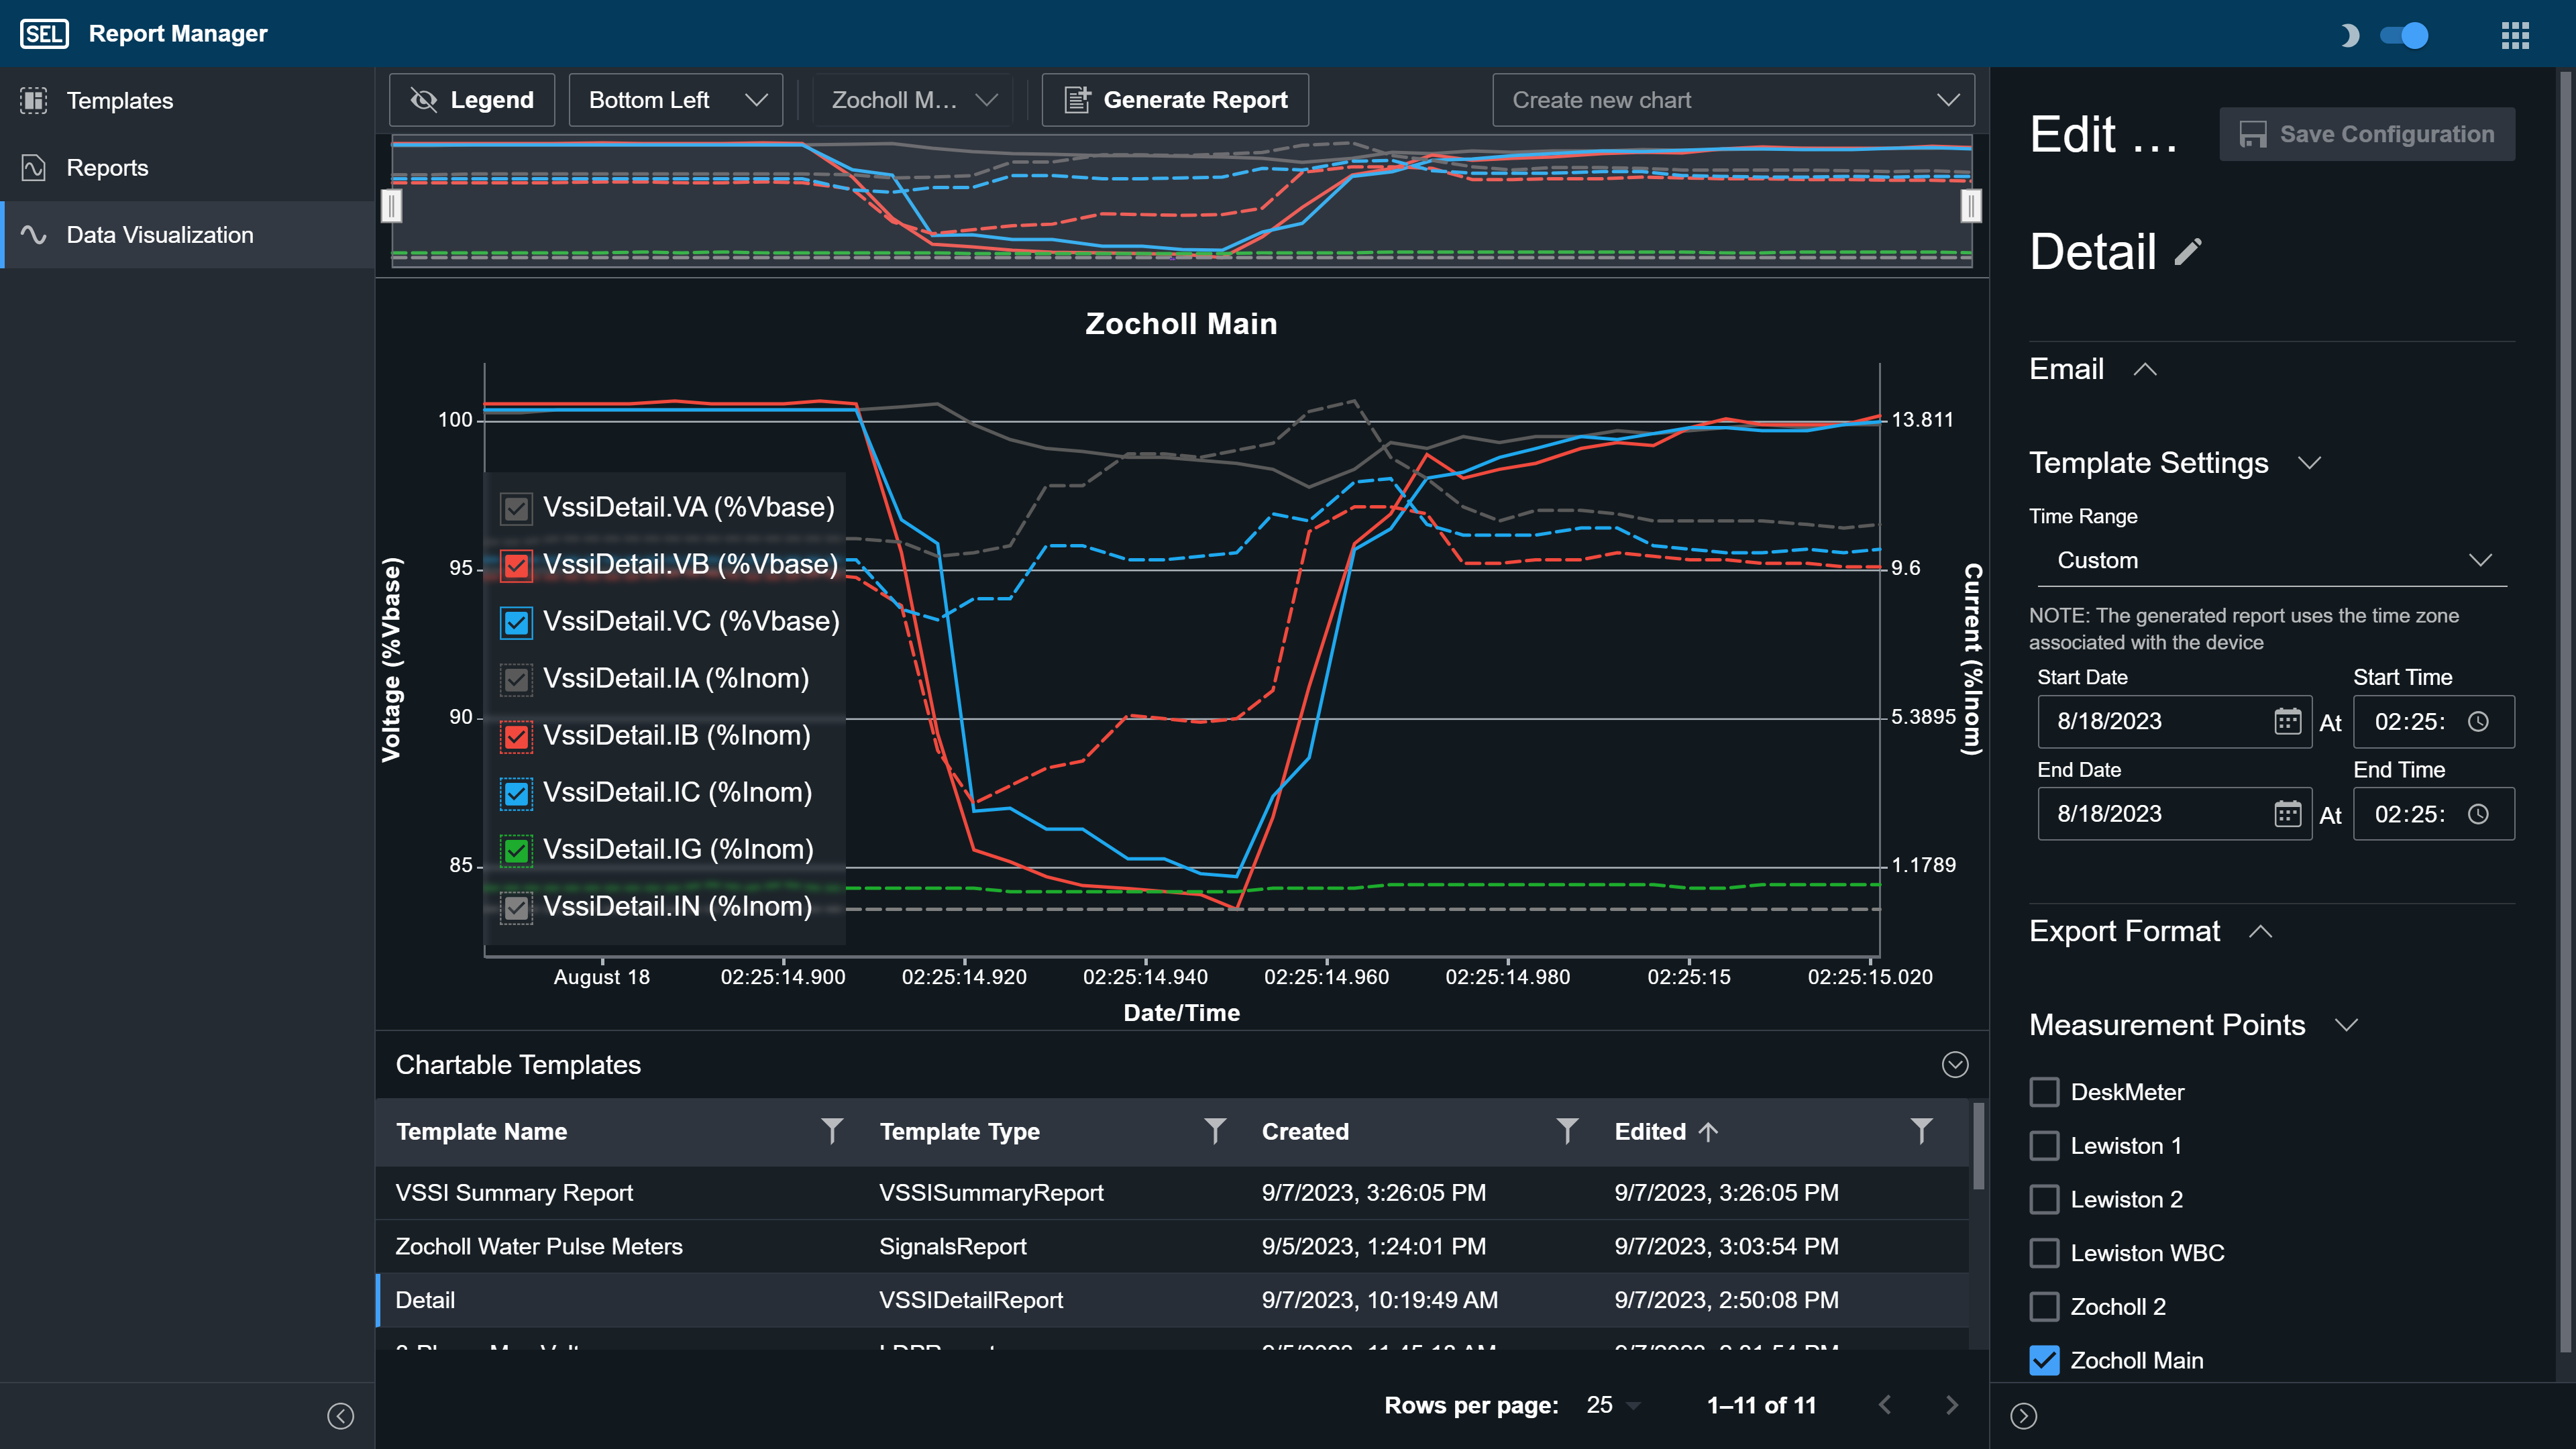
- Easily visualize metering data collected by Synchrowave Reports using the web interface.
- Select a chart template for any configured reports.
- Adjust the time range for a visualization to focus on events or other areas of interest.
- Export data for the current visualization for further analysis or recordkeeping.
1
2
3
4
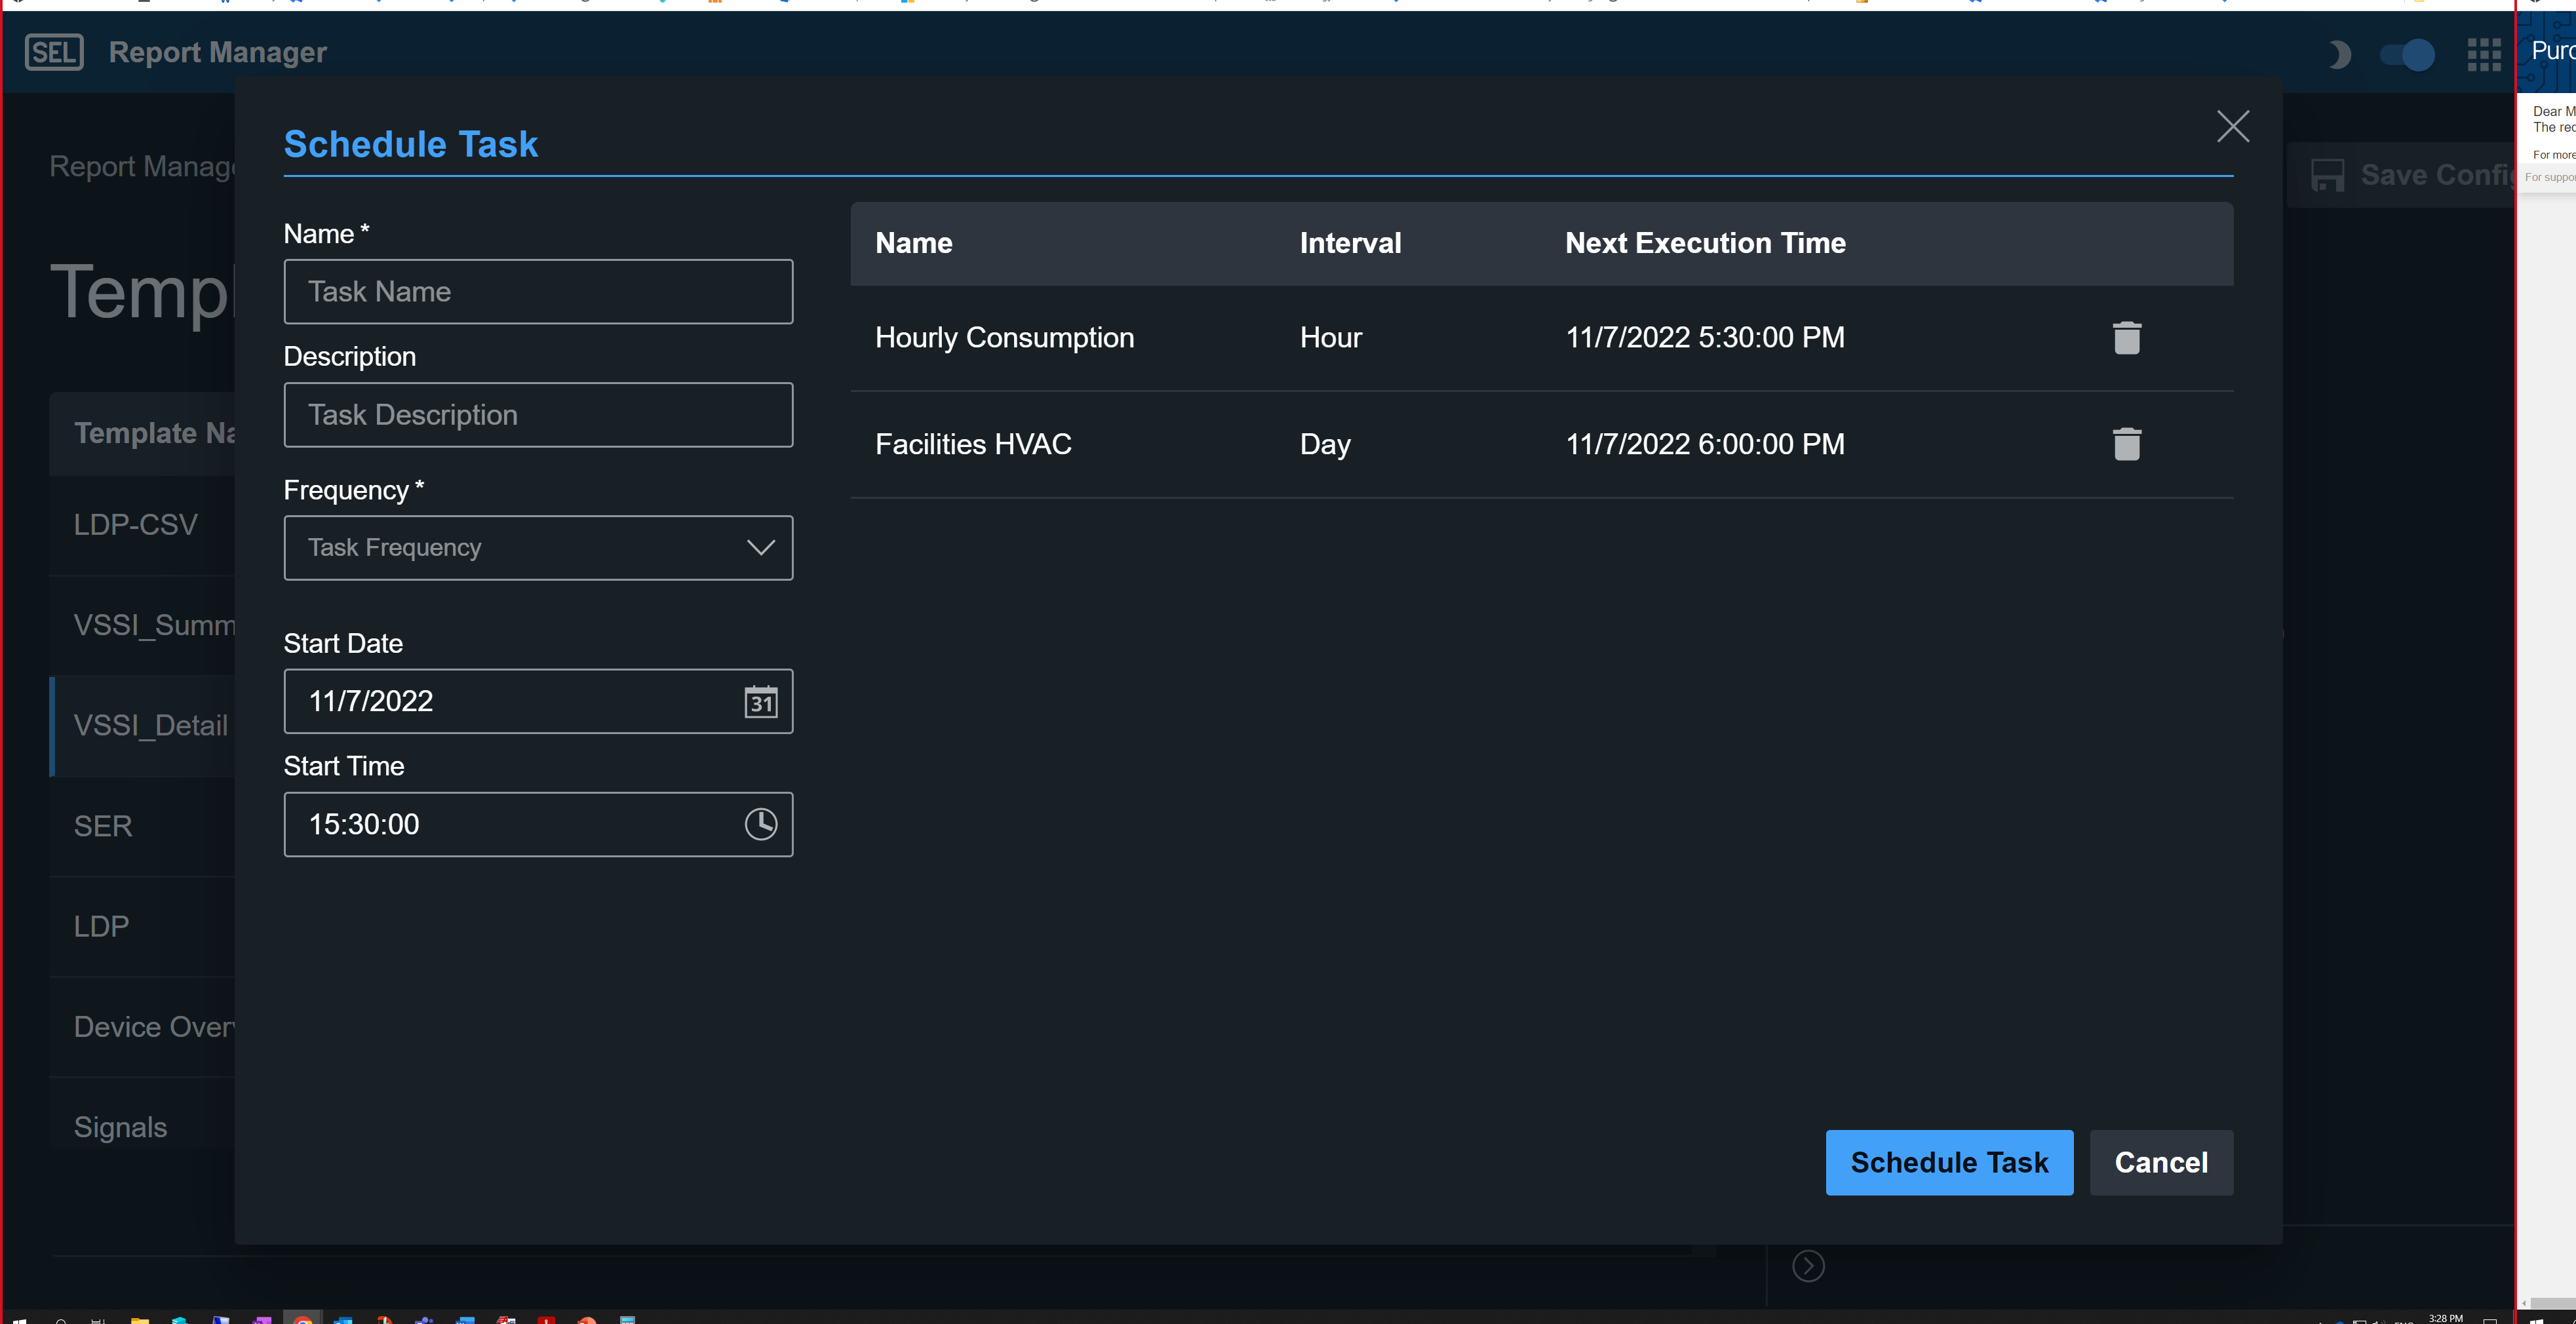
- Scheduled tasks can be given custom names for easy identification and analysis.
- Reports can be generated as often as every 15 minutes.
- Set reporting times to align with processes in your application.
- See and edit all scheduled reports in one location.
1
2
3
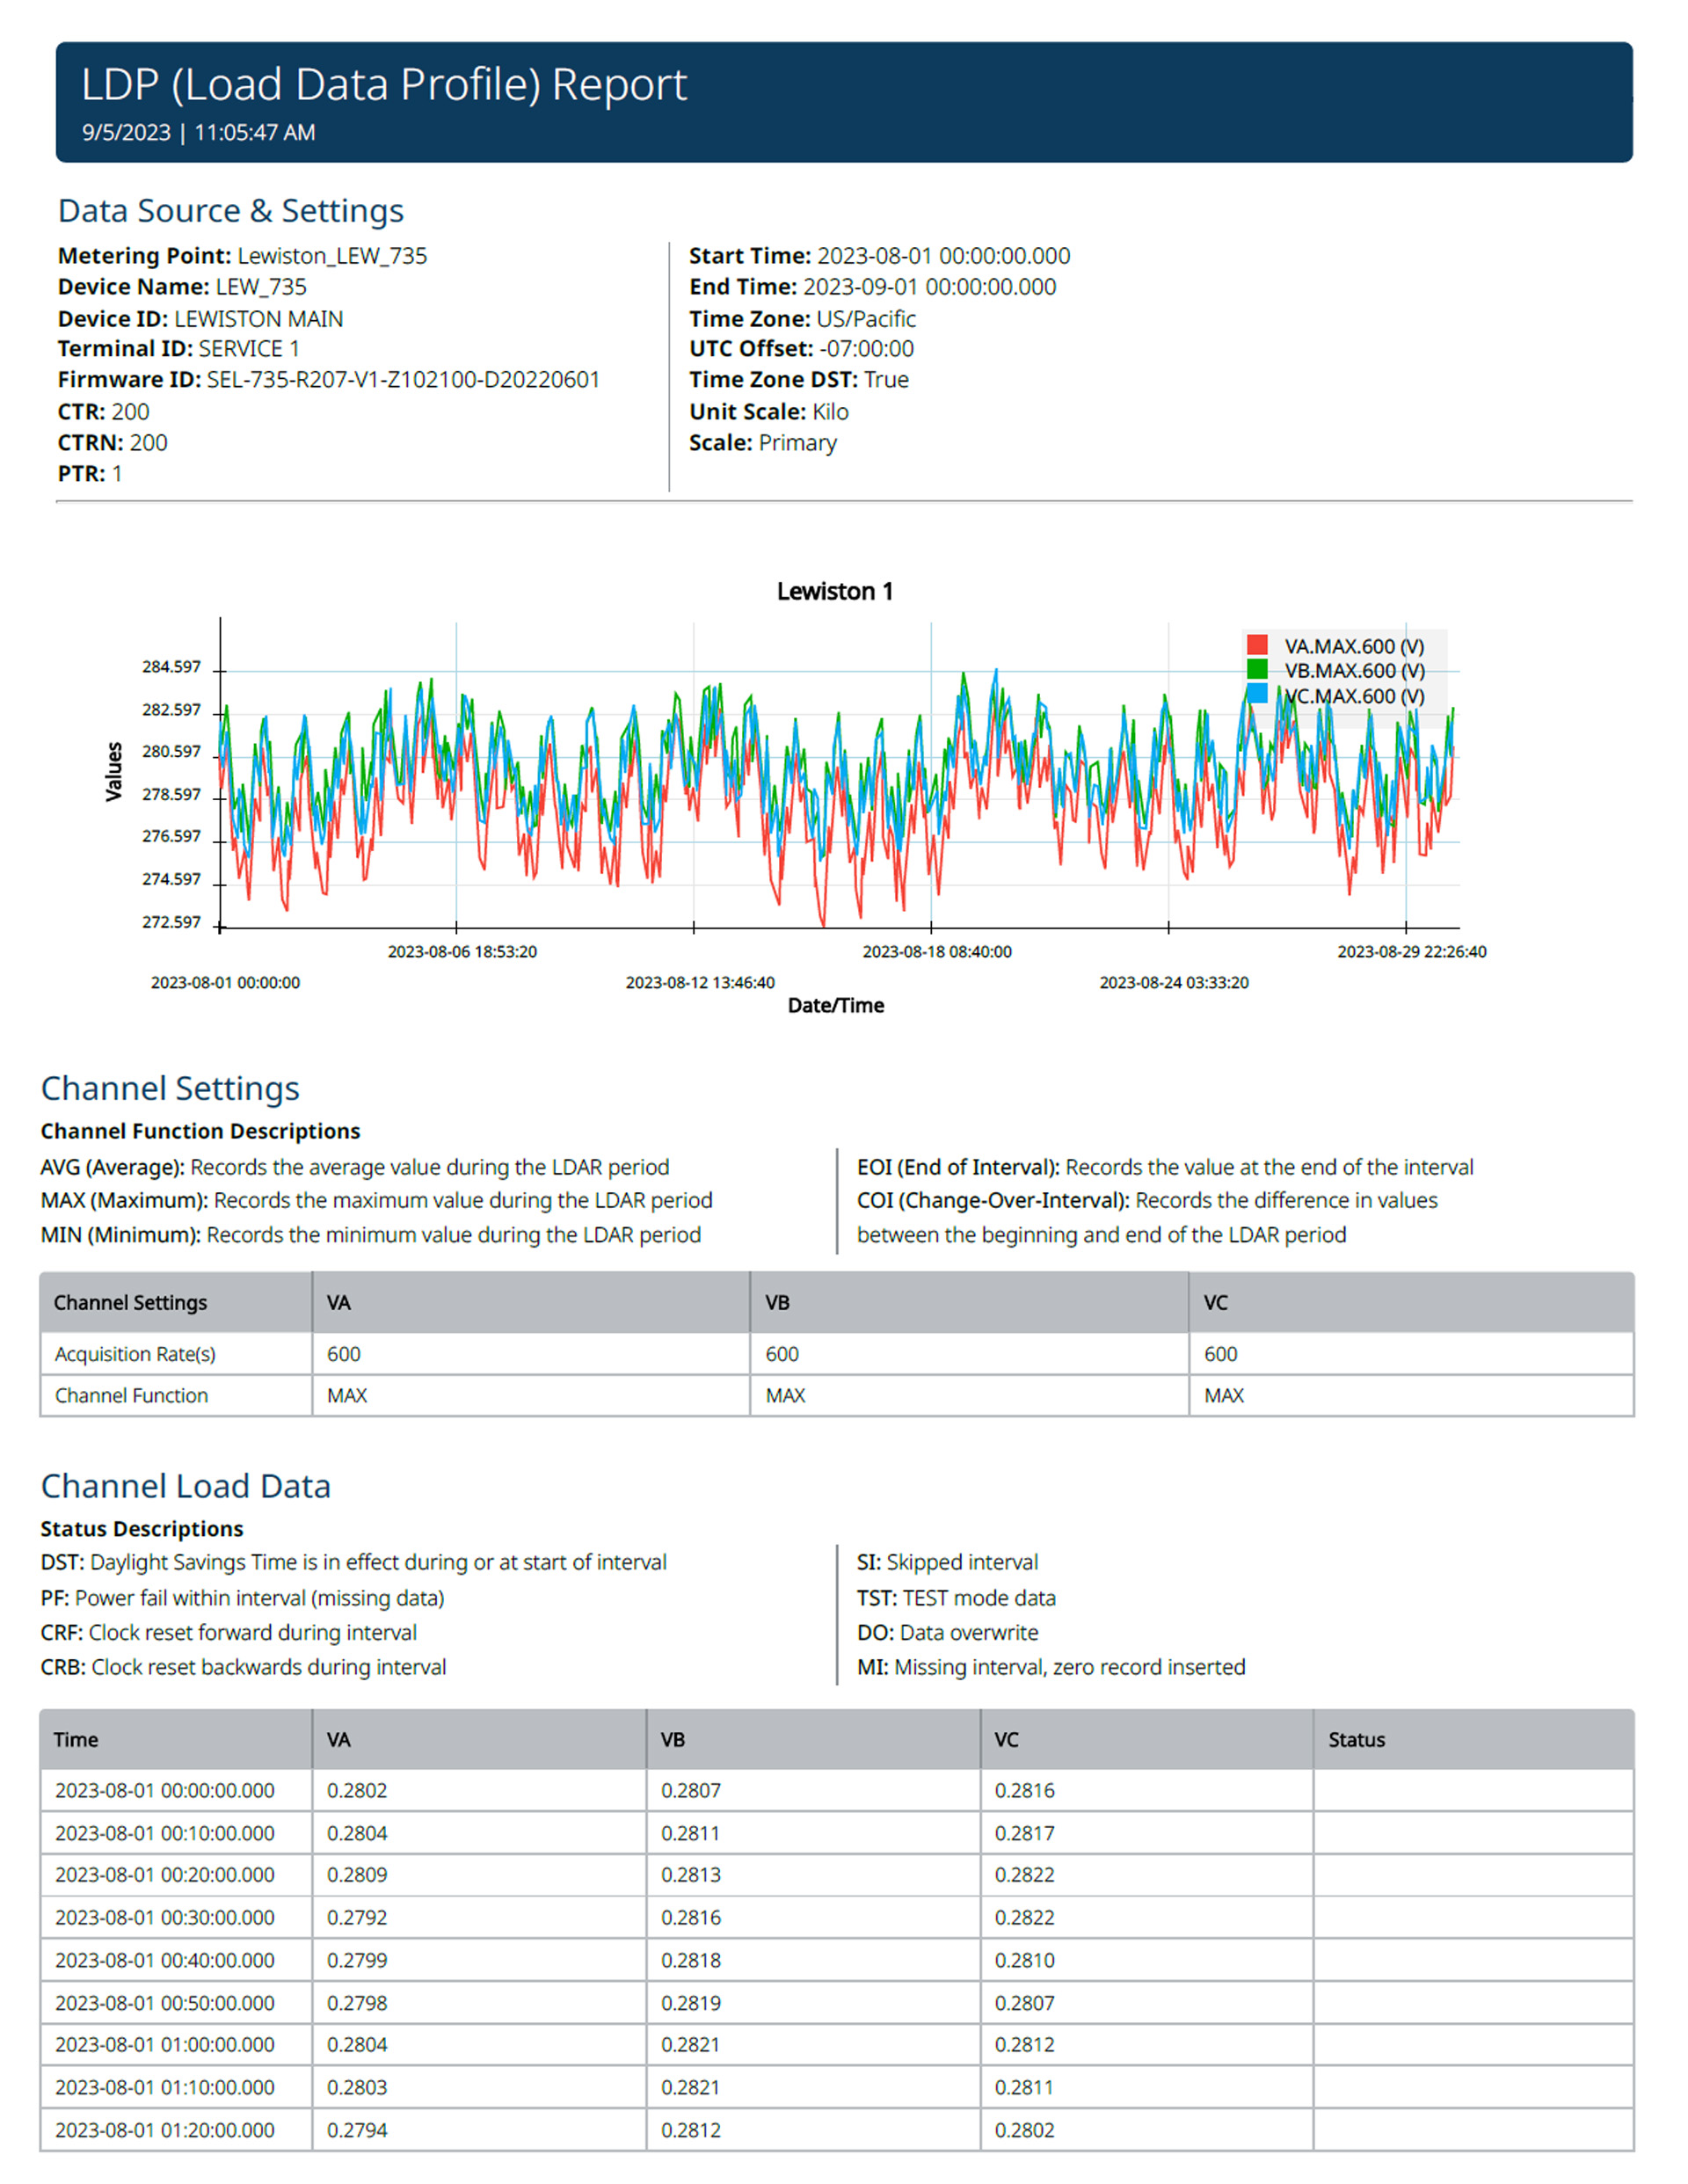
- Predesigned reports are styled for readability, allowing operators to quickly find data they need.
- Visualize the health of your power system using intuitive, time-stamped charts.
- PDF reports include tabular data and keys to support data analysis and interpretation.