
SEL-5601-2
Synchrowave Event Software
Synchrowave Event helps engineers diagnose a protective relay’s behavior during a power system fault. It is a powerful yet easy-to-use solution for displaying and analyzing SEL relay event reports and COMTRADE files. To learn more, download your FREE 60-day trial of Synchrowave Event.
Budgetary Retail
Single-Seat License: $711
Analyze Relay Event Data—Plot relay oscillography, display phasor magnitudes and angles, and monitor the status of digital elements. Navigate through events with integrated zoom and pan functions.
Time-Align Event Reports—Easily coordinate multiple event report times for accurate comparison and analysis of signals from multiple relays or past event reports.
Perform Calculations—Create equations to analyze specific trip conditions. Instantly plot calculation results for quick event analysis. The built-in function library creates endless calculation possibilities.
COMTRADE Viewer—View COMTRADE reports from a variety of sources together in Synchrowave Event for complete COMTRADE file analysis.
Visualize Distance Elements—Analyze protective relay distance element operation with the exact mho circle diagram. The mho circle diagram enables plotting apparent impedance and distance element characteristics for analysis.
Save Analysis Setup Time—Create personal and relay specific analysis templates to provide a customized view into the relay’s operation. Save and share templates for more efficient post-event analysis.
Understand Differential Element Performance—View the current differential ratios plotted directly onto the complex alpha plane. Supporting both two- and multi-terminal lines, you can overlay the differential ratio with the restraint region to quickly identify when the differential element picked up. Experiment with alternative restraint regions to explore the effects of alternate protection settings.


See Traveling Waves
Advanced Fault Location Visualization—The SEL-411L Advanced Line Differential Protection, Automation, and Control System, the SEL-T400L Time-Domain Line Protection, the SEL-T401L Ultra-High-Speed Line Relay, and the SEL-TWFL Dual Traveling-Wave Fault Locator and 12-Channel MHz Recorder can record traveling-wave data to provide highly accurate fault locating. Synchrowave Event generates a Bewley lattice diagram from the traveling-wave data to enable visualization, analysis, and understanding of the traveling waves recorded for an event.
Features
-
- 1
Compare measurements
Drag cursors throughout the event report to compare measurements.
- 2
Analyze relay event data
Plot relay oscillography, display phasor magnitudes and angles, and monitor the status of digital elements. Navigate through events with integrated zoom and pan functionality.
- 3
Search for signals
Quickly add analog and digital signals to charts by filtering signals as you type in the search bar.
- 4
Perform calculations
Create equations to analyze specific trip conditions. Instantly plot calculation results for quick event analysis. The built-in function library creates endless calculation possibilities.
- 5
Time-align event reports
Easily coordinate event report times for accurate comparison and analysis of signals from multiple relays or past event reports.
- 6
Add event records
Load a new event record or add records to the current analysis session. Report formats including COMTRADE (including those used for viewing and analyzing traveling waves), SEL ASCII (.EVE) event report, SEL Compressed ASCII (.CEV), Comma-Separated Values (.CSV), Motor Start Report (.MSR), Sequential Events Recorder (.SER), SEL-T400L and SEL-T401L Event Playback (.PLY) file, and SEL Zipped Event (.EVZIP) file formats are supported.
123456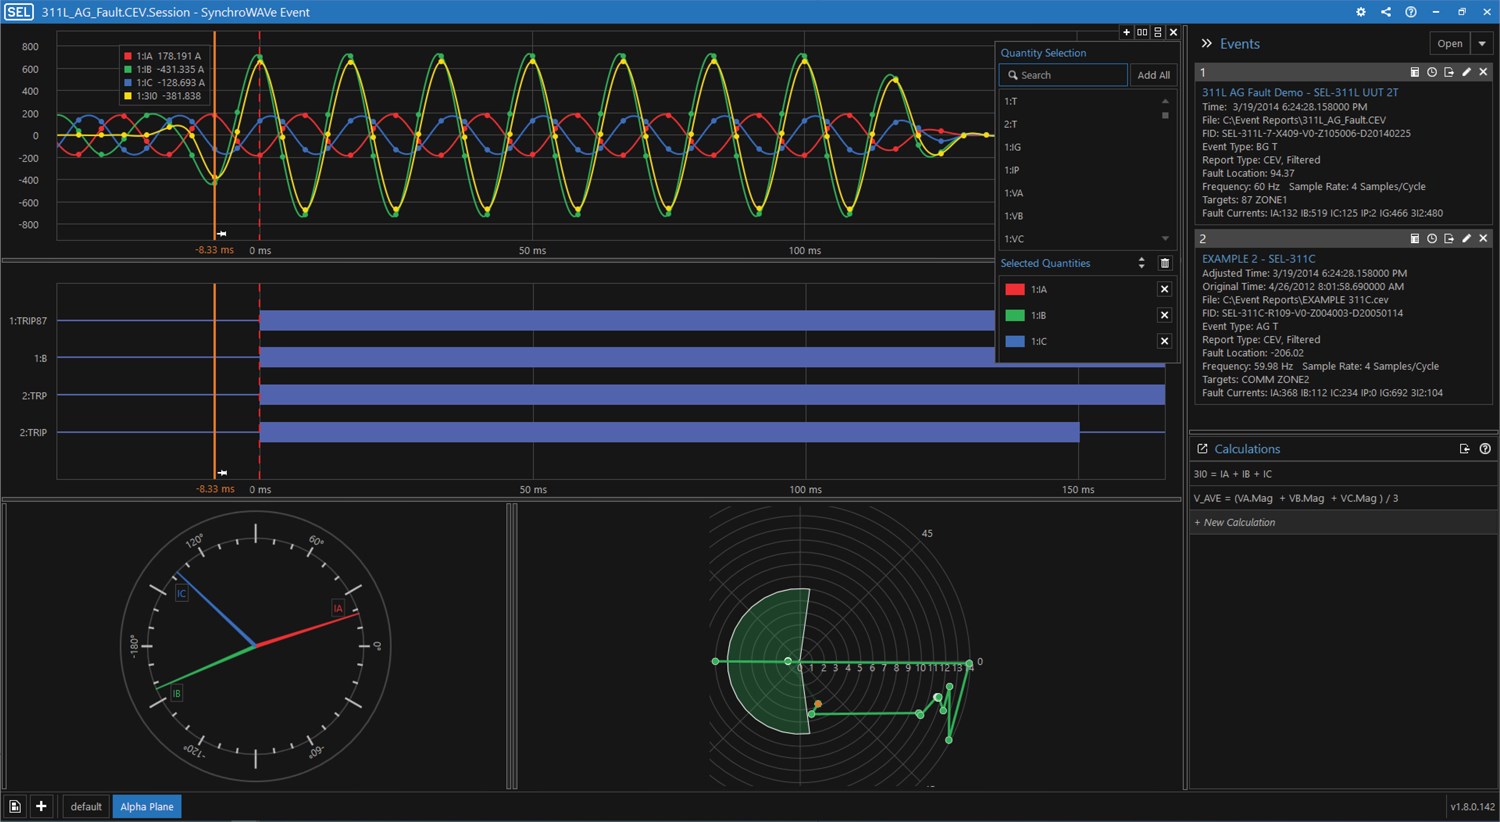
-
-
- 1
Mho Circle Analysis
Analyze distance element operation with the mho circle diagram. The mho circle diagram provides an impedance plane on which to plot apparent impedance and distance element characteristics.
- 2
Choose your zone
Quickly turn on and off each of the distance element zones.
- 3
Pinpoint the impedance
Drag the cursor throughout the event to see the apparent impedance. The yellow dot indicator shows you where the impedance is on the plane.
- 4
See the mho characteristic move
See the distance element as the relay sees it. Observe how the mho circle characteristic moves in response to changes in the polarizing voltage.
1234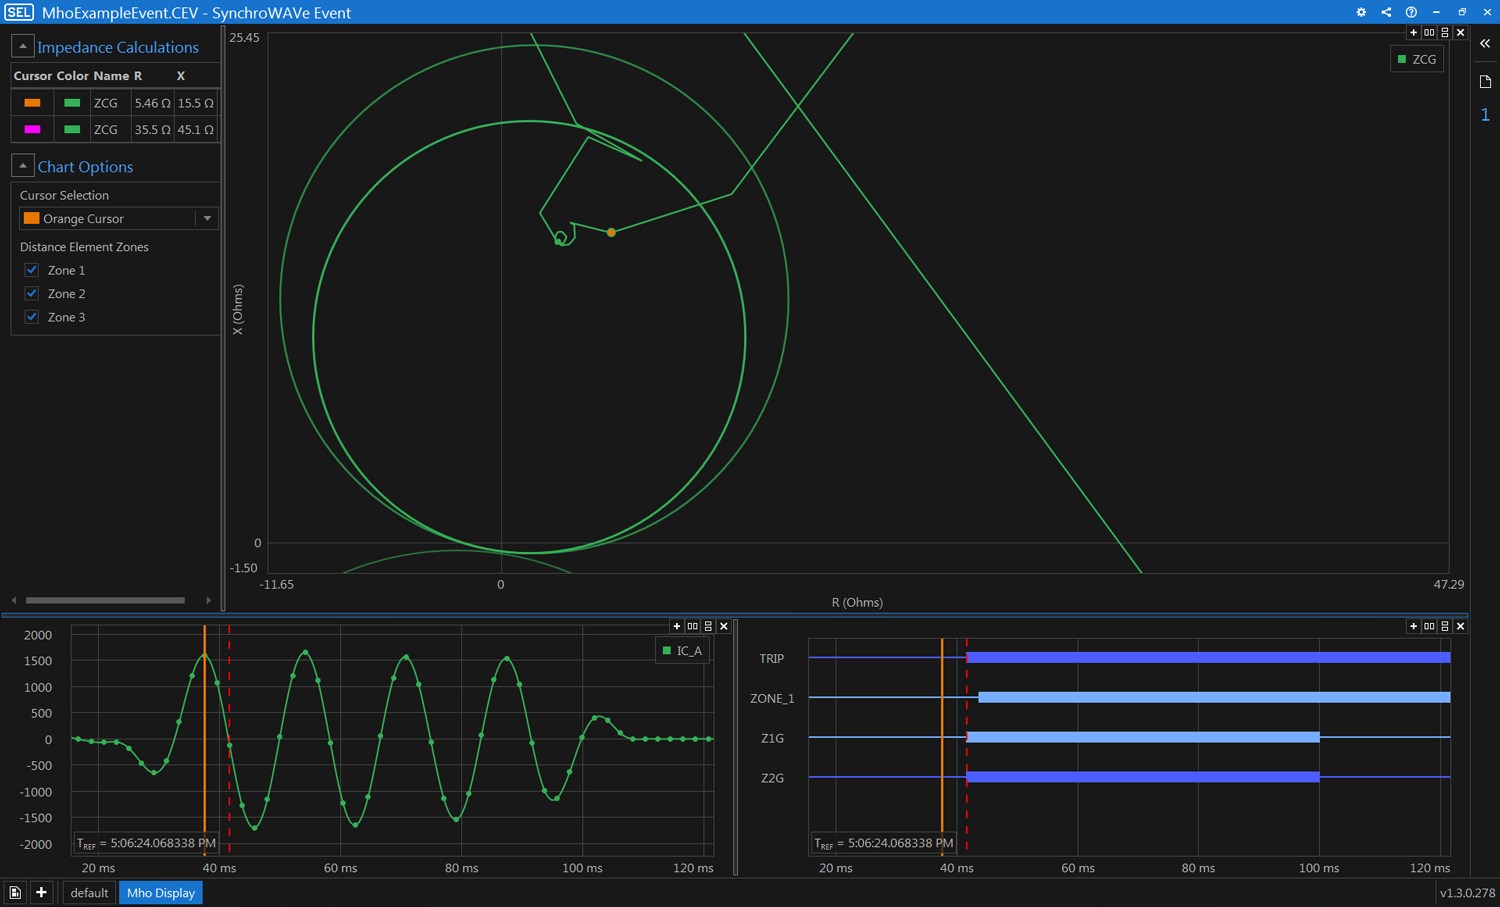
-
-
- 1
Refine parameters
Easily adjust the line length based on updates from the field. Use multiple peak locations to adjust the wave propagation speed or wave propagation travel time to compensate for line sag, air temperature, and humidity. Feed this information back into relay settings for improved relay operation.
- 2
Pinpoint the reflection
See the traveling-wave arrivals detected at the terminal. The Bewley diagram shows the traveling wave’s propagation path along the transmission line and reflections from fault and line terminals.
- 3
Identify the fault point
The fault location is represented by the vertical gray bar. From this point, traveling waves are launched in each direction.
- 4
Locate faults with a double-ended method
Easily import event records that contain traveling-wave data from both ends of the line. Slide the time cursors to line up with the peak of the initial traveling wave that arrived at each line terminal to obtain a highly accurate fault location. Optionally, fine-tune the results by placing additional time cursors on traveling waves that arrived at each terminal after reflecting from the fault or opposite terminal.
- 5
Locate faults with a single-ended method
Visualize the traveling wave propagation through the fault after reflecting off a terminal. The difference in arrival times between the initial traveling wave at the local terminal and the first traveling wave that was reflected from the fault can be used to locate the fault using a single-ended method. The arrival time of a traveling wave that reflected off the remote terminal and propagated through the fault enables the adjustment of either the traveling wave propagation speed or propagation time.
12345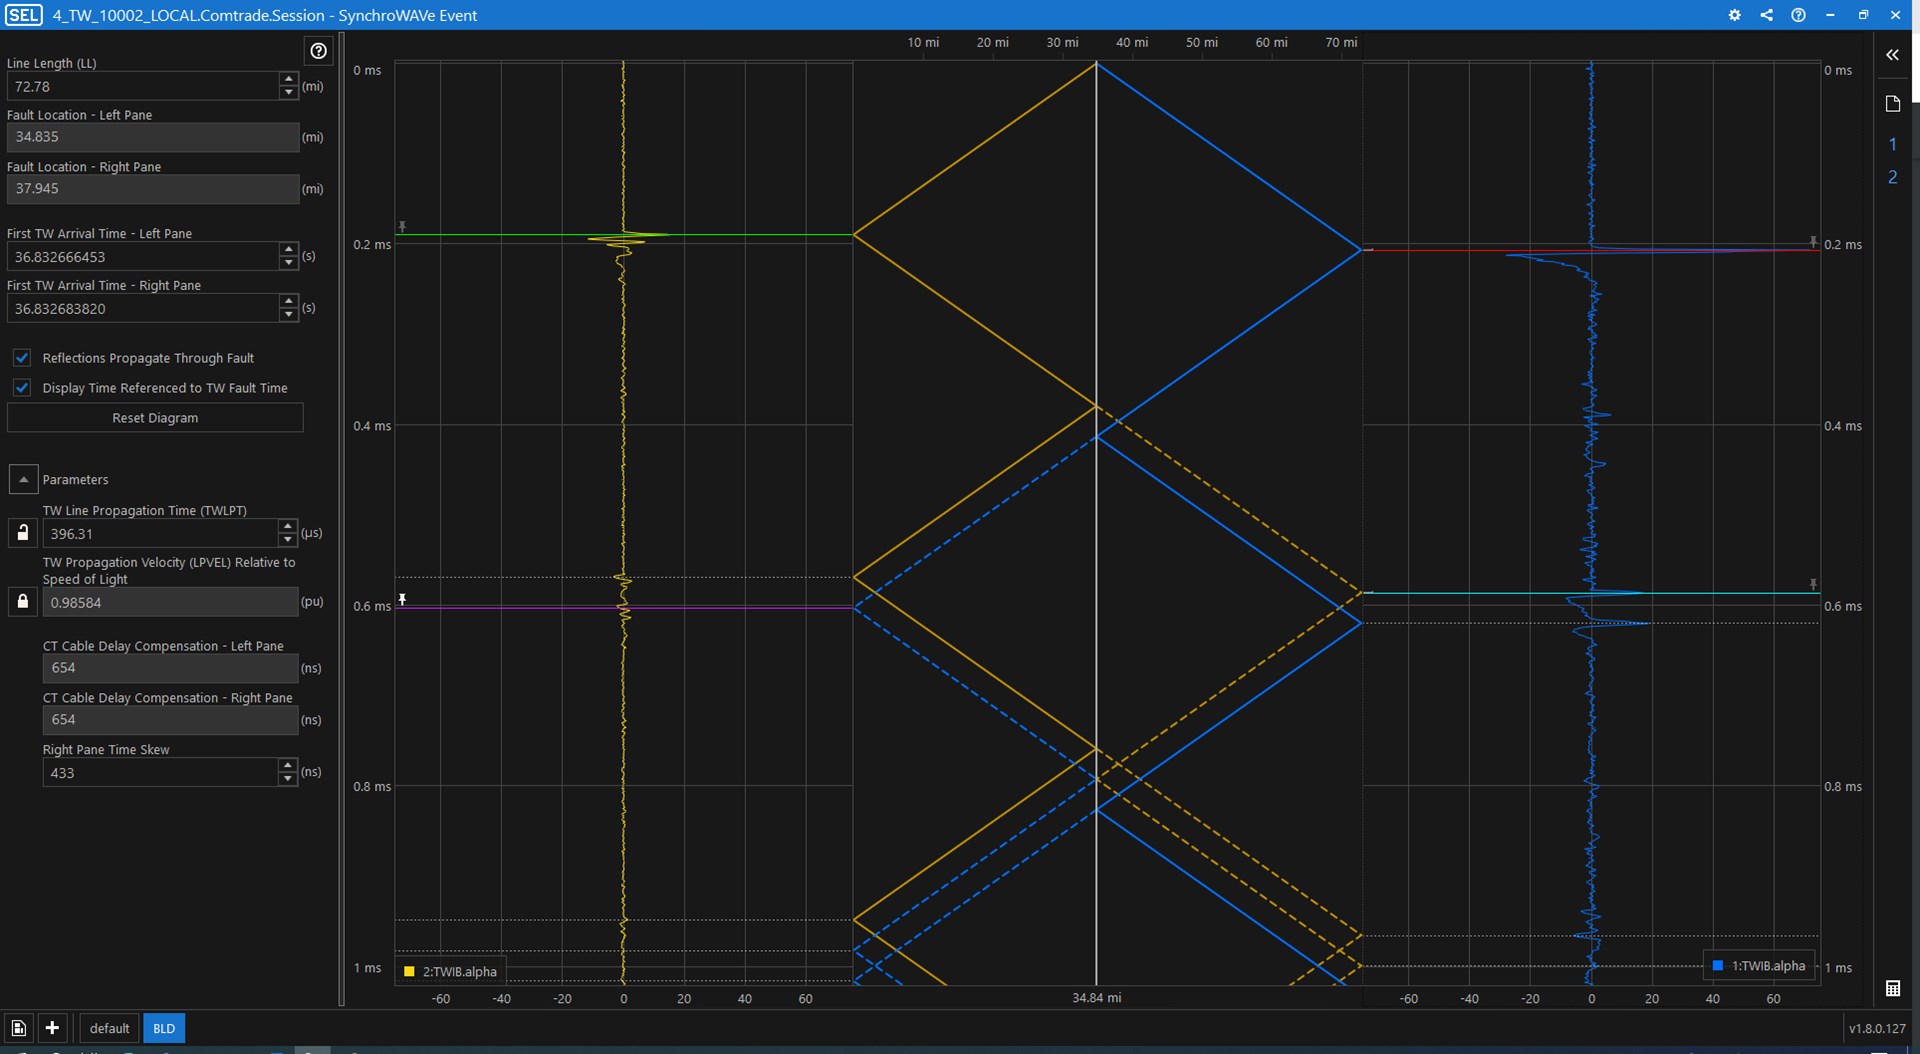
-
Details
Supported Operating Systems
- Microsoft Windows 10 (64-bit)
- Microsoft Windows 11 (64-bit)
Additional Features
- Frequency spectrum analysis
- Harmonic analysis
- Export data to COMTRADE and .CSV
- View relay settings
- Print screen captures
- Complex chart
Event File Support
- COMTRADE (including those used for viewing and analyzing traveling waves)
- SEL Compressed ASCII (.CEV) event report
- SEL ASCII (.EVE) event report
- Motor Start Reports (.MSR, .CMSR)
- Sequential Events Recorder (.SER, .CSER)
- Comma-Separated Values (.CSV)
- Meter LDP and SER data (.bin)
- Voltage Sag, Swell, and Interruption Report (.txt)
- SEL-T400L and SEL-T401L Event Playback (.PLY) file
- SEL Zipped Event (.EVZIP)

Synchrowave Event
Relay event visualization and analysis software.
Video Playlists
Synchrowave Event Software Support
- How to Use Synchrowave Event: Overview
- Synchrowave Event: Deriving V1 and V2 With Custom Calculations
- Synchrowave Event—How to Use the Complex Chart, Part 1: Overview
- Synchrowave Event—How to Use the Complex Chart, Part 2.1: Visualizing IOP and IRT Signals
- Synchrowave Event—How to Use the Complex Chart, Part 2.2: Visualizing Differential Characteristics
- Synchrowave Event—How to Use the Complex Chart, Part 2.3: Analyzing 87R Behavior
- Tips & Tricks: Viewing Sequential Event Recordings in Synchrowave Event
- Tips & Tricks: Zooming and Panning in Synchrowave Event
The Firmware IDs for older versions of the firmware can typically be found in Appendix A of the instruction manual.
Instruction Manuals
Sales Resource Central access is required to view the content in this tab.
Sales Resource CentralSynchrowave Event provides a 60-day free trial of licensed features. After the 60-day trial, you can purchase a license or continue to use the unlicensed features. Visit the Synchrowave Event comparison page to view licensed versus unlicensed features.
The license for Synchrowave Event does not expire. Once you have licensed Synchrowave Event, you may use that licensed version in perpetuity. The license is applicable to any upgrades with the same major version number. For example, the major version number for version 1.3.2 refers to the first digit, so this would be a 1.x.x major version. The license does not work with a 2.x.x version of Synchrowave Event.
Synchrowave Event is licensed per computer. Contact your local SEL sales representative to learn about volume pricing for Synchrowave Event.
Click here for information on the Customer Licensing Portal to manage your software licenses.
5601-2 - Software Tab
Supporting Software
SEL Device Management and Automation (DMA) Application Suite
Available on the Blueframe platform, SEL DMA applications automatically collect, store, and manage device-specific information like oscillography, Sequence of Events (SOE) data, device settings, and property information as well as providing automated password rotation and streamlined device audits.
Learn more on the DMA software page.
acSELerator Team SEL-5045 Software
Team automates the collection of power system data—such as event reports, Sequence of Events (SOE) data, and meter profile data—storing it in a central location for easy access with other SEL software.
Learn more and download on the Team software page.
SEL Compass
Compass provides simple and convenient tools for managing SEL digital content. Users can keep software applications and relay configuration drivers up to date without manually browsing product webpages as well as download new product updates and literature.
Learn more and download on the Compass software page.