
SEL-5702
Synchrowave Operations
Increase grid safety and reliability through situational awareness with high-resolution time-series data, real-time analytics, and geographical information system (GIS) location information. Synchrowave Operations complements traditional SCADA systems and energy management systems (EMSs) by delivering power system insights that SCADA can’t provide.
Try the software and see live data now. SEL is streaming synchrophasor measurements from wall outlets across the United States to a demo version of SEL-5702 Synchrowave Operations. With your mySEL account, you can easily log in to this demo software to visualize live data and try out key features of Synchrowave Operations.
Synchrowave Software Comparison Chart
Budgetary Retail:
WASA Application Package for 50 Streaming Devices:$65,400 + Yearly Subscription of 15%
Wide-Area Situational Awareness—Synchrowave Operations improves situational awareness by providing live, subsecond, and time-aligned information from across the entire power system. Waveform signatures provide additional insight into the dynamic behavior of the power system, which enhances decision making during abnormal conditions.
Real-Time Visualization—Operators will promptly see the system response after switching a line in or out of service. Unreliable behaviors, like a growing oscillation or a failed breaker reclose cycle, are visible instantaneously with subsecond resolution that enables quick identification and response before the issue impacts the power system.
Intelligent Analytics and Notifications—Real-time analytics applications constantly monitor streaming data and provide notifications that give the operator access to key event data, including the location and impact, with a single click.
Secured Access to Data and Applications—Applications and all dependencies run self-contained, resulting in reduced attack surfaces. Access to the platform is restricted to authorized users via Lightweight Directory Access Protocol (LDAP) authentication.
Renewable Energy Monitoring—High-resolution data lets operators measure and track the impact of renewables. Integrating renewable energy into the power system can result in reduced system stability and new oscillatory modes. System dynamics from these generation sources change quickly—too fast to see at traditional SCADA rates.
Power System Model Validation—To accurately replicate events, power system studies rely on accurate system models. Synchrowave Operations will record the system response to system events, such as capacitor switching, generator trips, load shedding, or other events. Comparing the recording to system models lets operators validate system security and reliability.
Equipment Failure Prevention—Automatically detect an impending PT failure with high-resolution time-series measurements. Early detection gives time for crews to schedule PT maintenance before a failure occurs.
Linear State Estimation (LSE)—Improve measurement accuracy and power system visibility with LSE. The LSE application uses network configuration and direct measurements to improve observability and calculate the topology and state of the power system, supplying operators with more precise information to support decision making.
Synchrowave for Grid Operations
Synchrowave Operations enhances existing utility power system operations by delivering power system insights that SCADA can’t provide through situational awareness.

High-Performance Platform
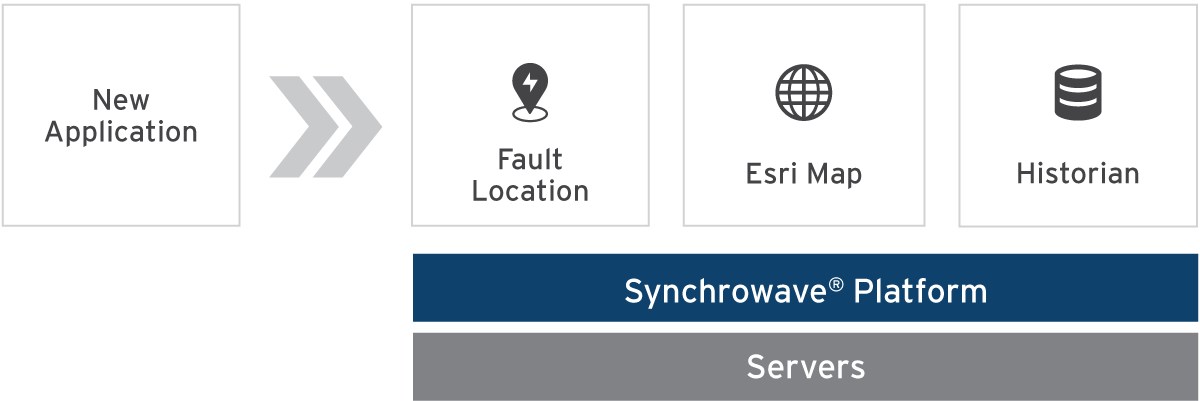
Synchrowave Operations is built on Synchrowave Platform, a scalable, resilient, and secure application platform for real-time power system operations and analytics. Synchrowave Platform brings state-of-the-art software technology to a secure private network. Applications on Synchrowave Platform work together to create new solutions for utility grid operation challenges. Each application is independent and communicates with the platform through interfaces, enabling new applications to quickly be developed and deployed. The platform is designed from the ground up with microservice and container technology, providing a robust and scalable platform for future growth.
Simple and Fast Application Deployment
Install, manage, and update applications quickly and independently. When a new application is released or an existing application is enhanced, that application is simply uploaded to the platform. The underlying container technology ensures the software suite is scalable, resilient, and secure.
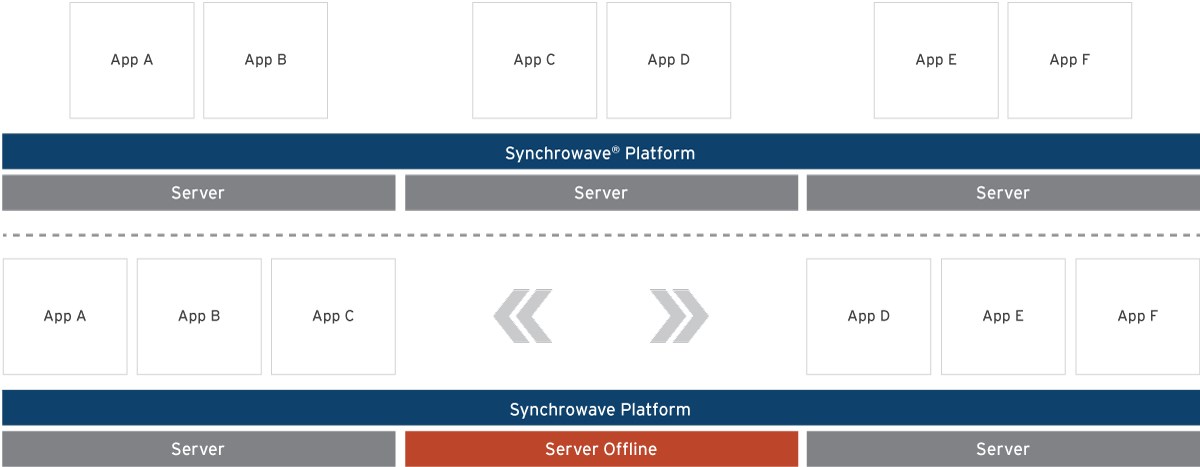
Resiliency and Availability for Grid Operations
During a server failure or maintenance, applications automatically rebalance and move to healthy servers in the platform’s cluster, ensuring critical applications are always operational.
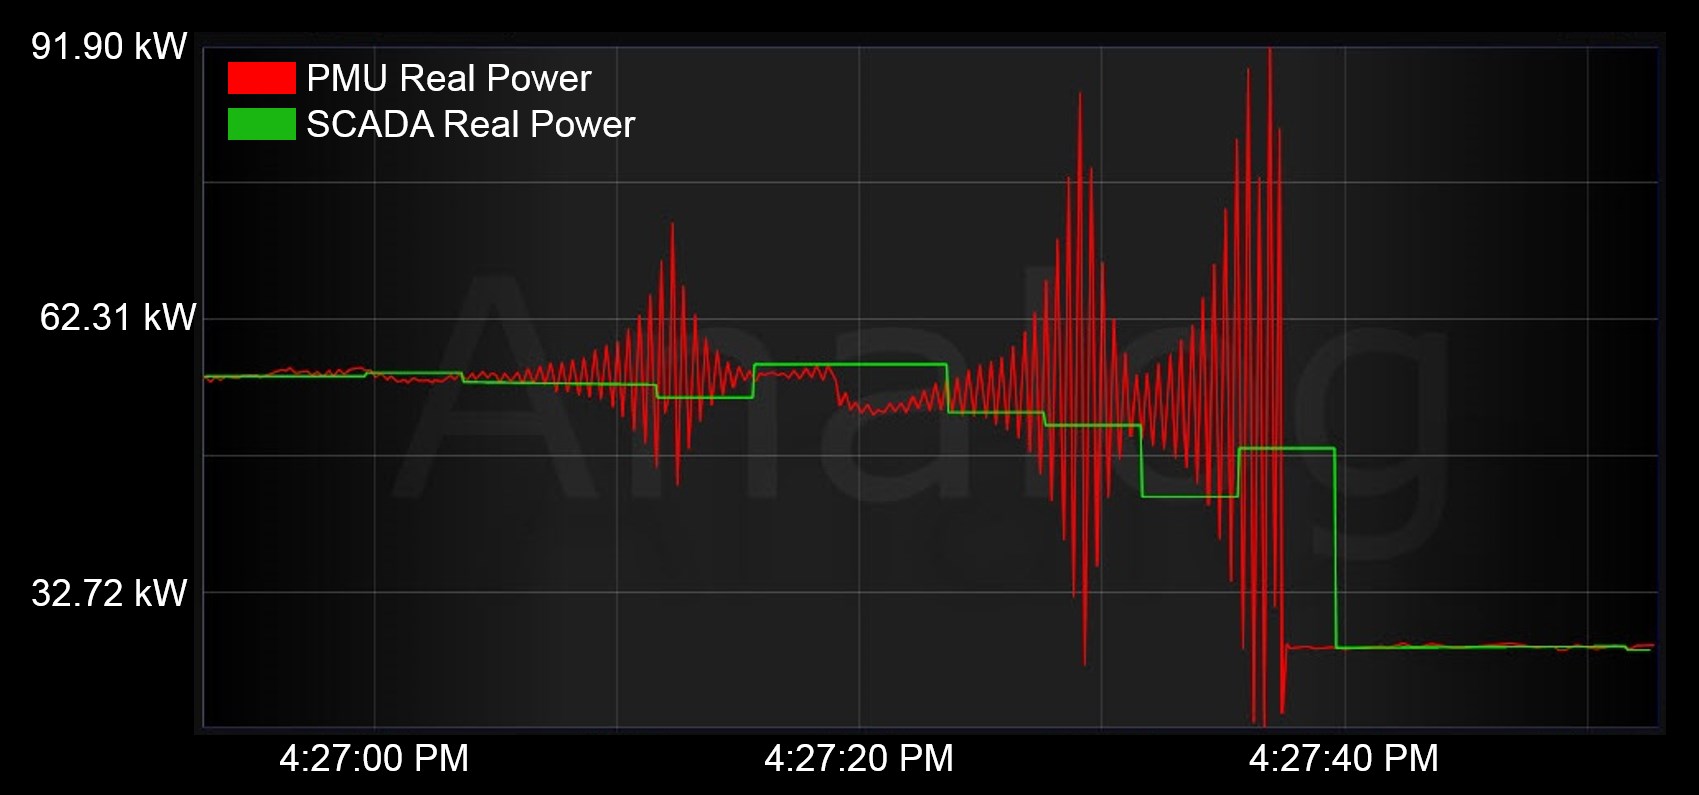
Know What’s Happening With High-Speed Time-Series Data
The dynamics of the power system are changing because of increased renewable energy integration. Traditional SCADA data rates fail to capture important information needed to maintain grid stability. Synchrowave Platform supports high-speed time-synchronized measurements, ensuring the operators know what is happening on the grid at all times and can make timely decisions.
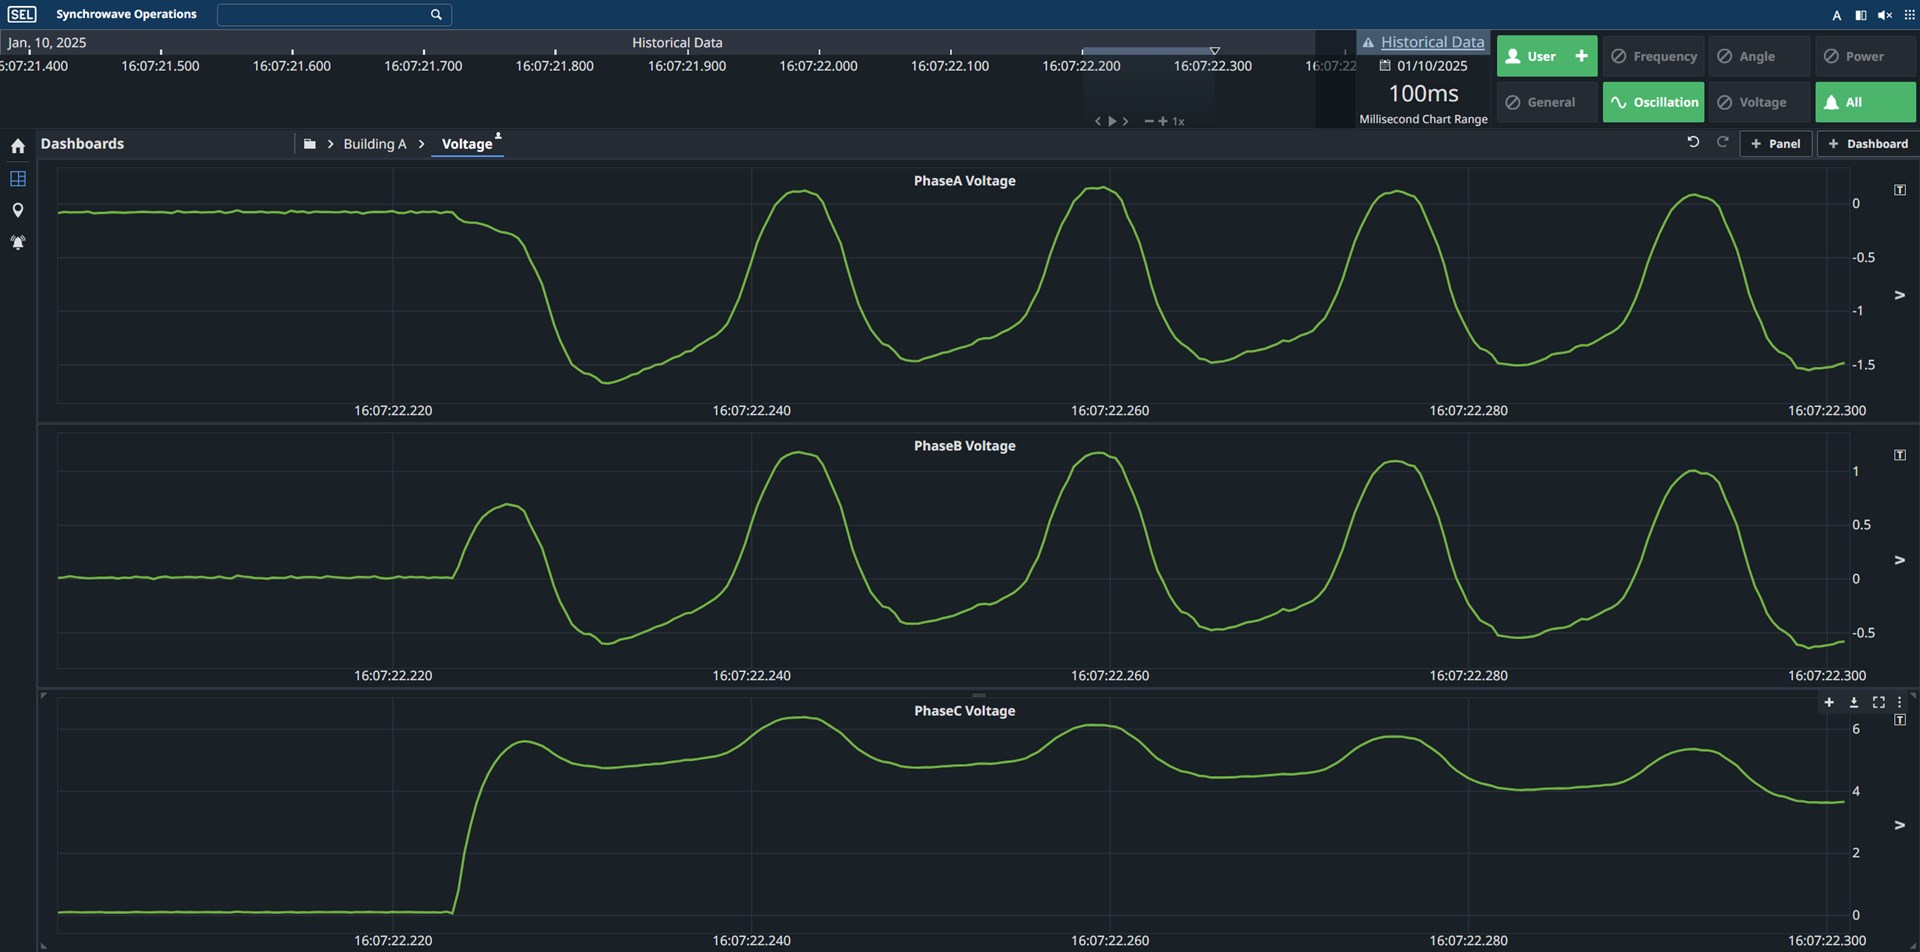
Improve Situational Awareness With Continuous Waveform Recording
Capture high-frequency events and phenomena using 3 ksps continuous waveform recording of voltage and current measurements.
Features
- Software Overview
- Phase Angle Monitoring
- Power Monitoring
- Voltage Monitoring
- Asset Investigation
- Generation Loss Detection and Location
- Instrument Transformer Monitoring
- Oscillation Monitoring
- Linear State Estimation
-
- 1
Timeline
- 2
Dashboard navigation
- 3
Real-time mode
- 4
Frequency notification
- 5
Notification summary
- 6
Substation, line, and pole GIS coordinates
- 7
Time-series trend panel
- 8
Numeric, phasor scope, and bar chart panels
12345678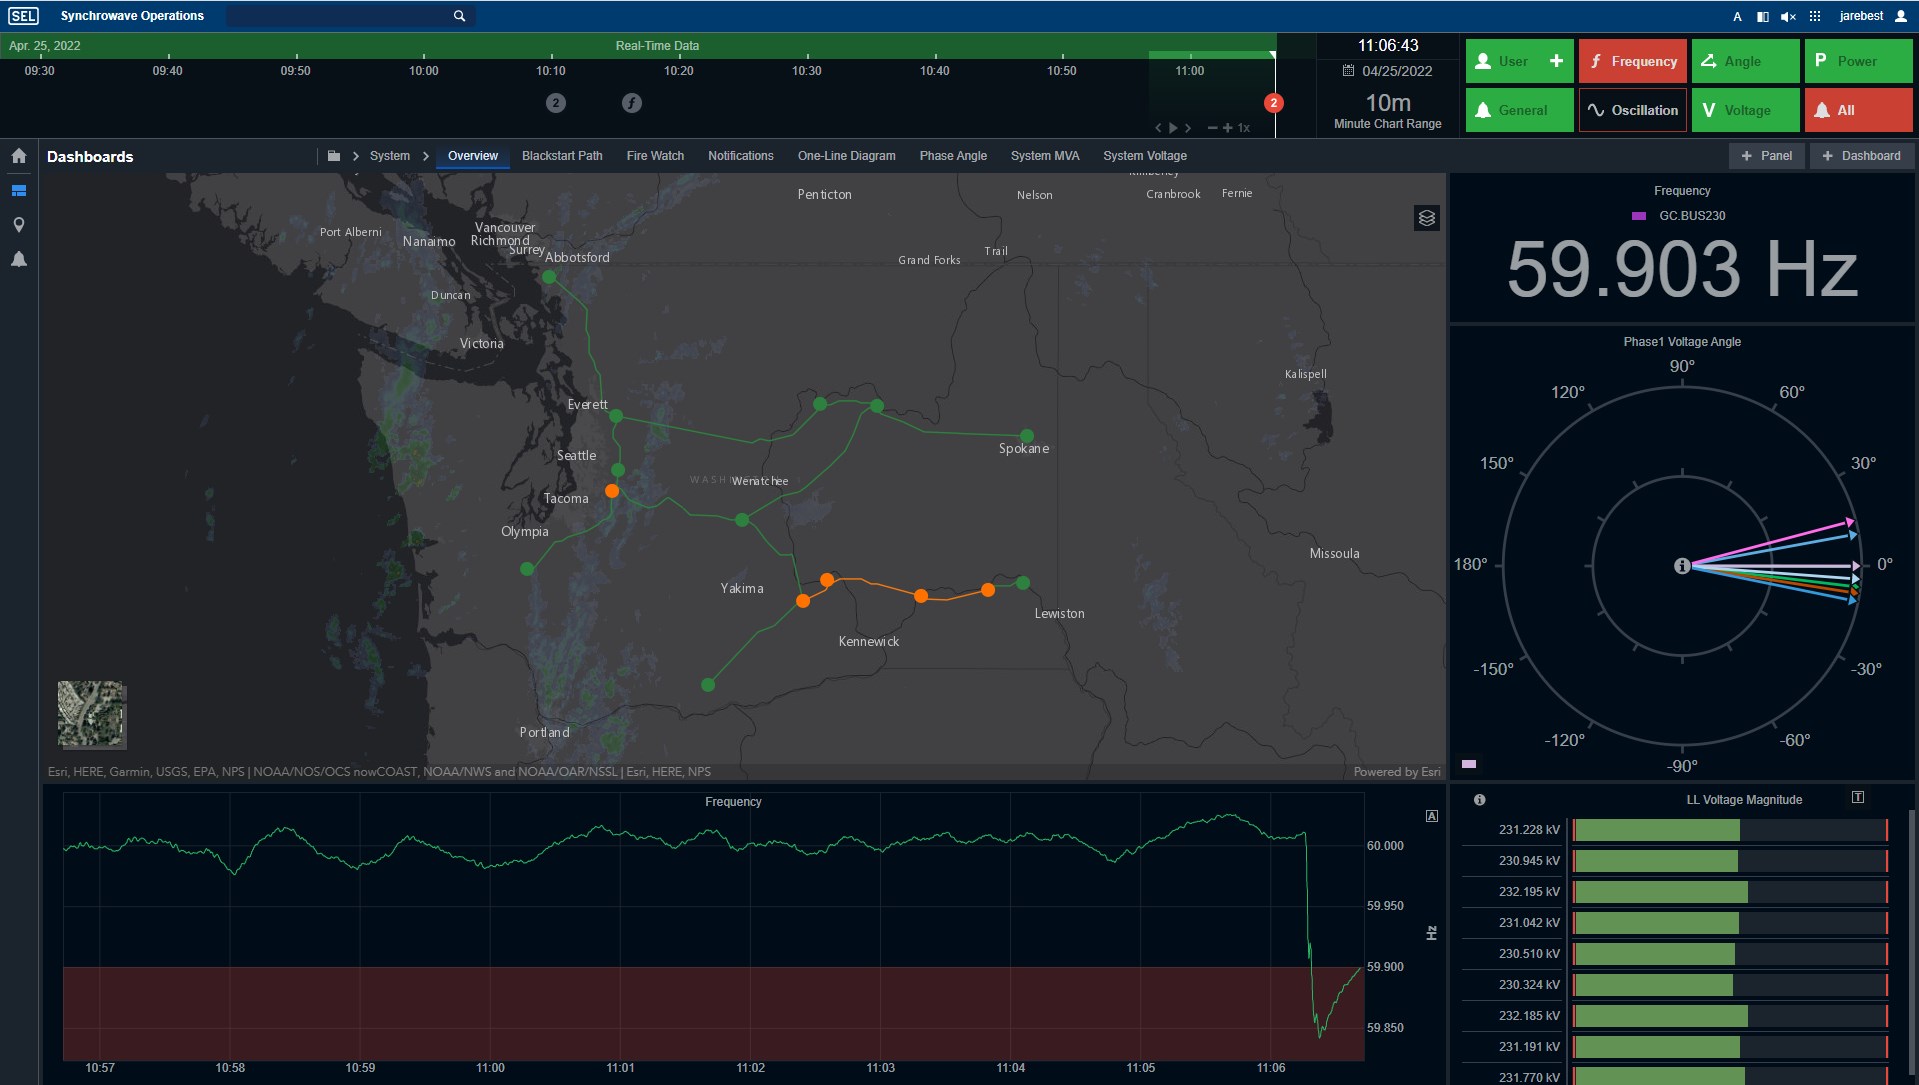
-
-
- 1
Measure system stress by measuring phase angle separation across the system with a phasor scope panel.
- 2
Monitor phase angle separation across specific assets, such as transmission lines and points of interconnection.
- 3
Compare and sort phase angle measurements against limits.
- 4
Trend phase angle measurements over time, and compare to limits. Get notified when a limit is crossed.
1234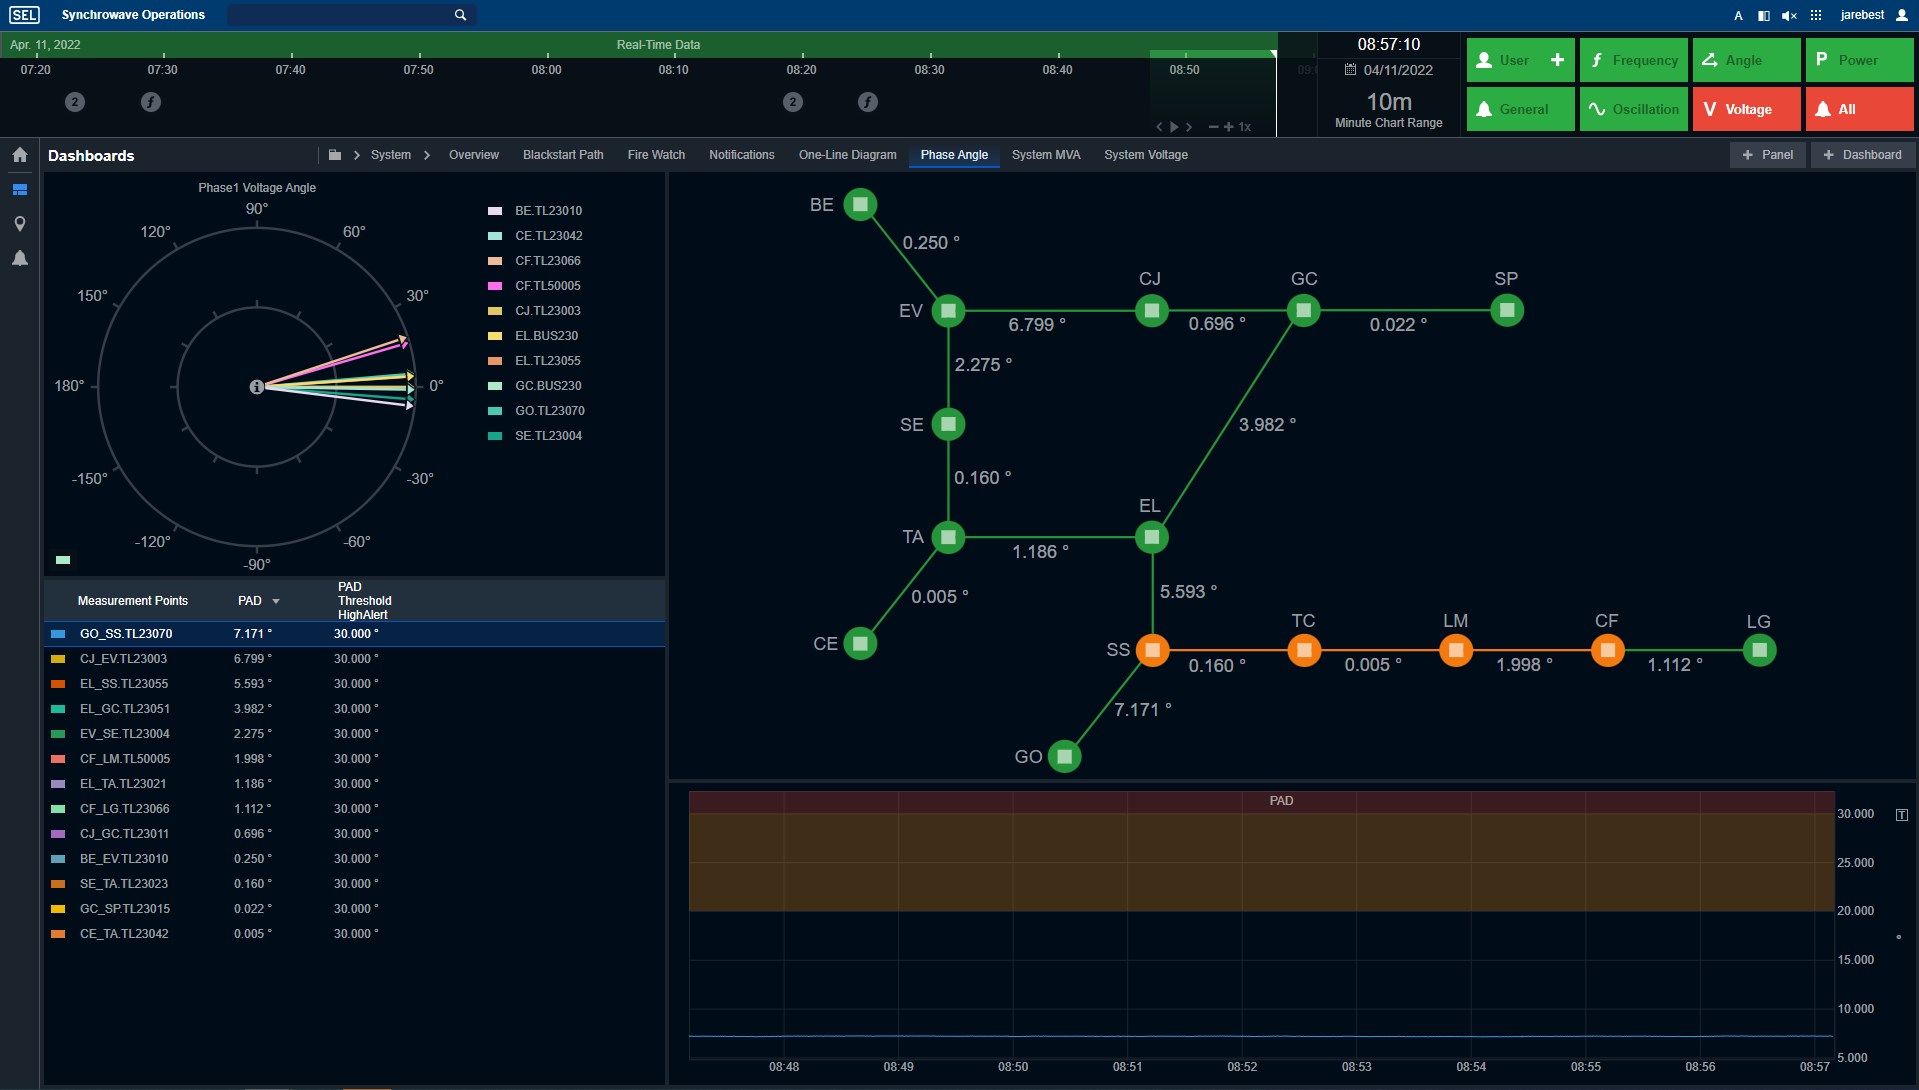
-
-
- 1
Monitor power limits across the system, such as transmission lines, power paths, and interconnections, with respect to their limits on a bar chart.
- 2
Calculate and trend power measurements (MVA, MW, MVAR, and power factor). Receive notifications when thresholds are crossed.
12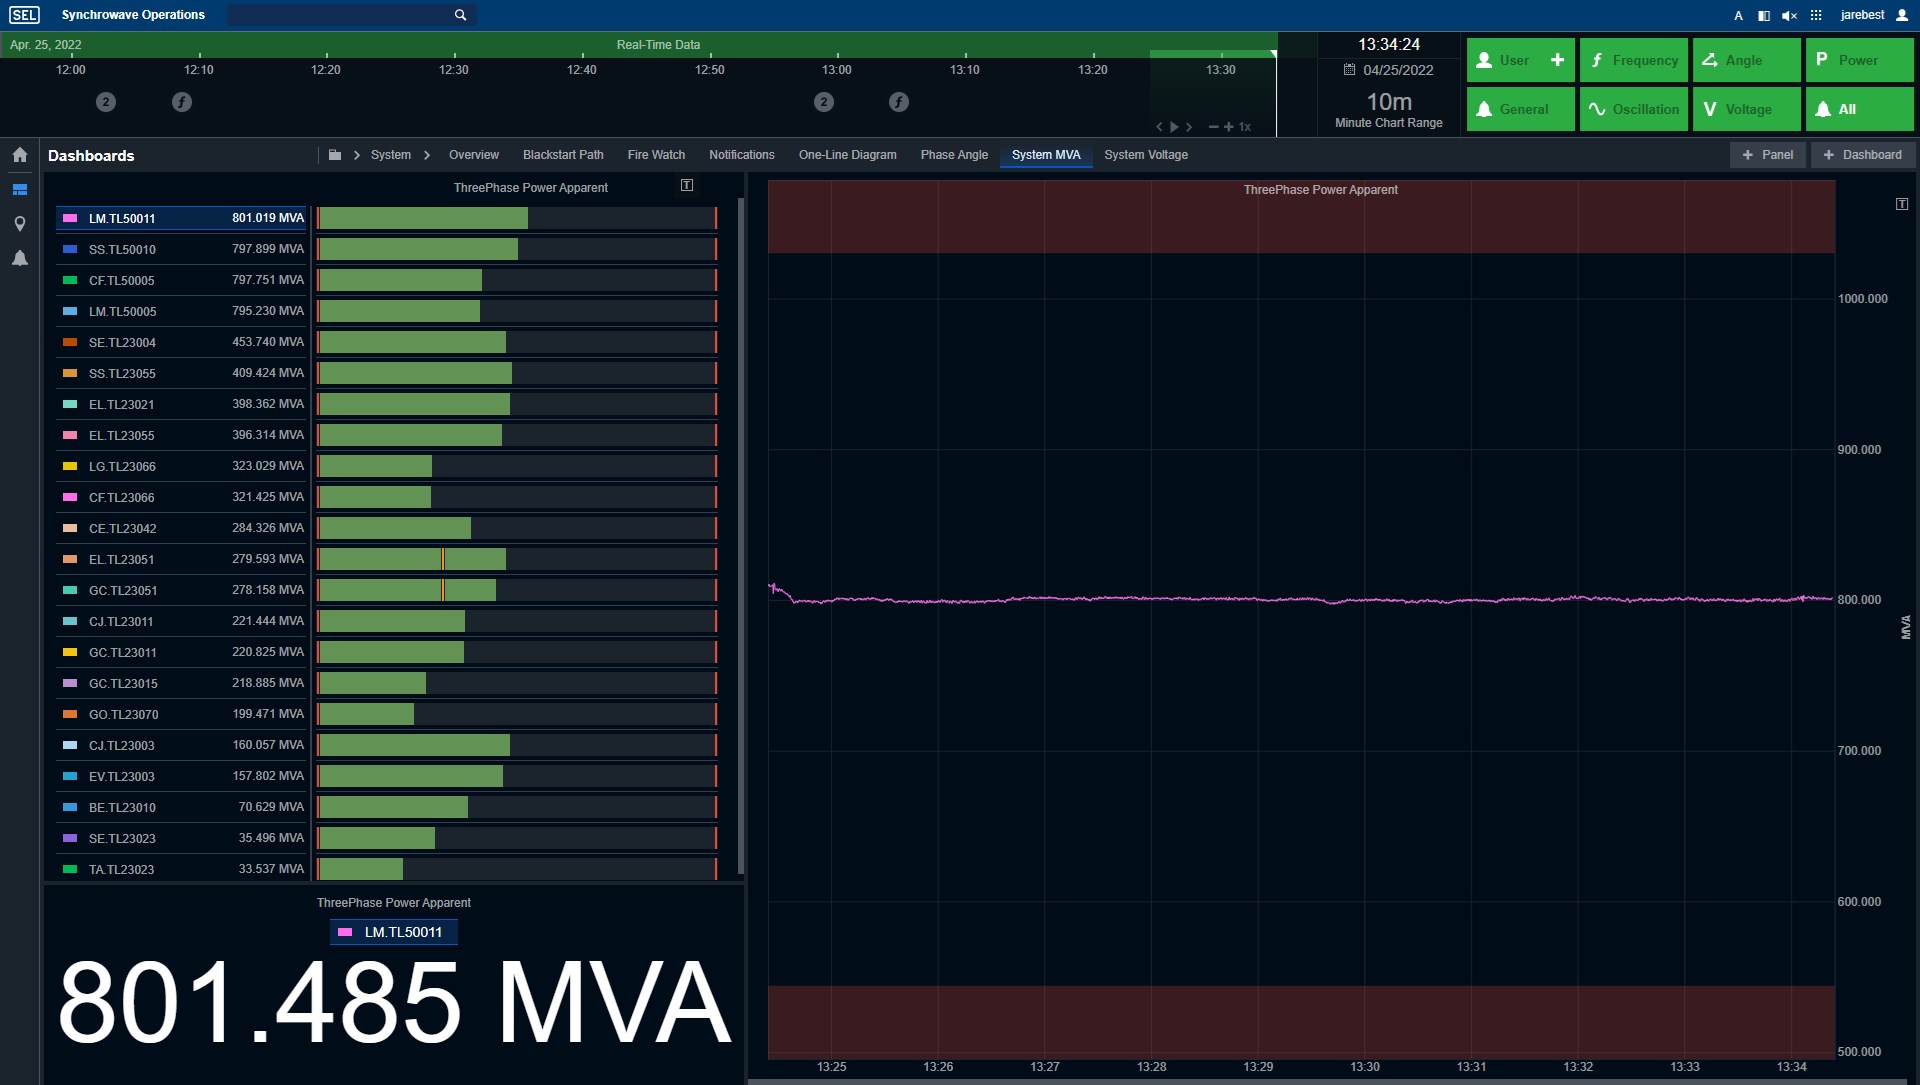
-
-
- 1
Identify pockets of high and low voltage geospatially with a voltage contour.
1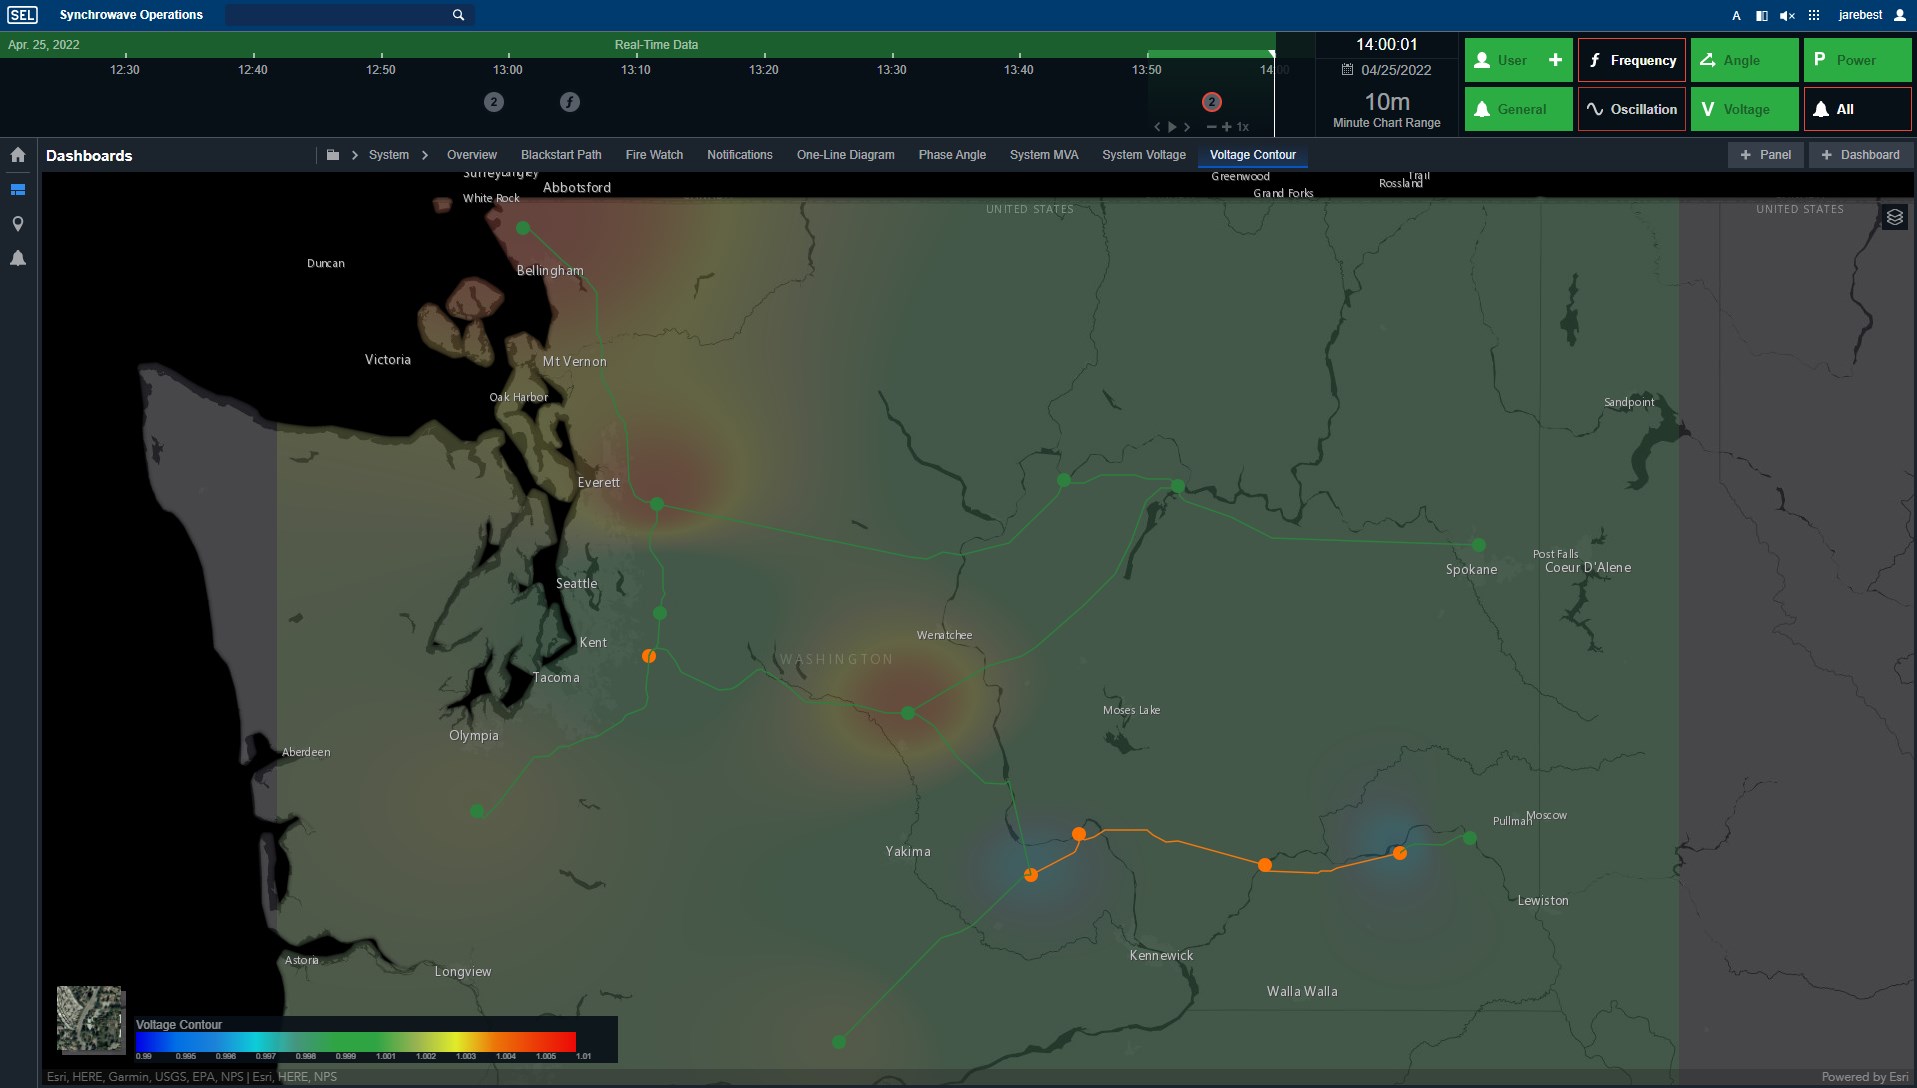
-
-
- 1
Quickly navigate to time-series data for any asset in the system via search.
- 2
See the geospatial location of the selected asset.
- 3
Monitor breaker status information for the selected asset.
- 4
Analyze real-time and historic time-series data for the selected asset.
- 5
Navigate quickly to additional dashboards for the selected asset.
- 6
Use asset dashboard templates to simplify dashboard updates and maintain consistency across assets.
123456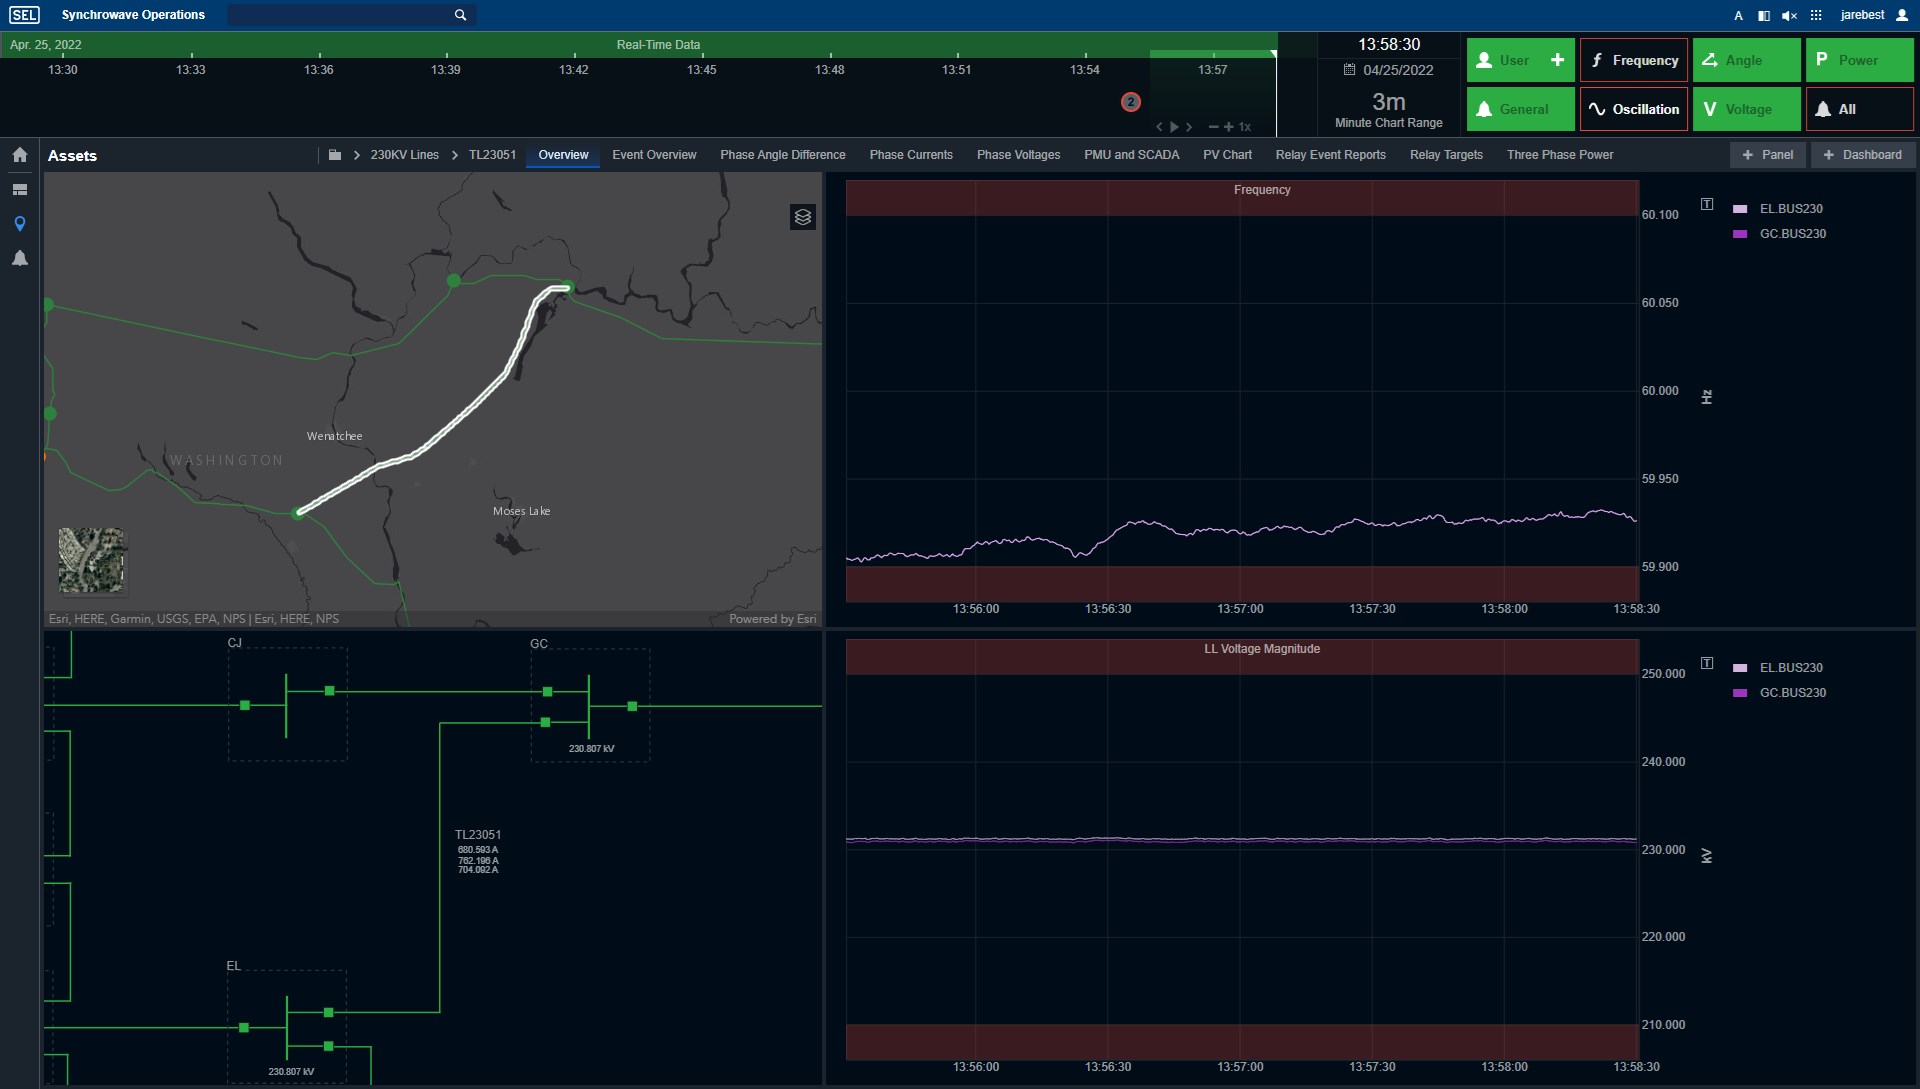
-
-
- 1
Receive a notification when a generation loss event is detected.
- 2
Use the geospatial display to visualize the propagation of the generation event through the power system so that operators and engineers can quickly determine the PMU closest to the location of the generation loss.
- 3
Quickly understand the source of the event and the overall frequency system response with the time-series trend and a visual overlay that automatically displays generation loss information without any user interaction.
123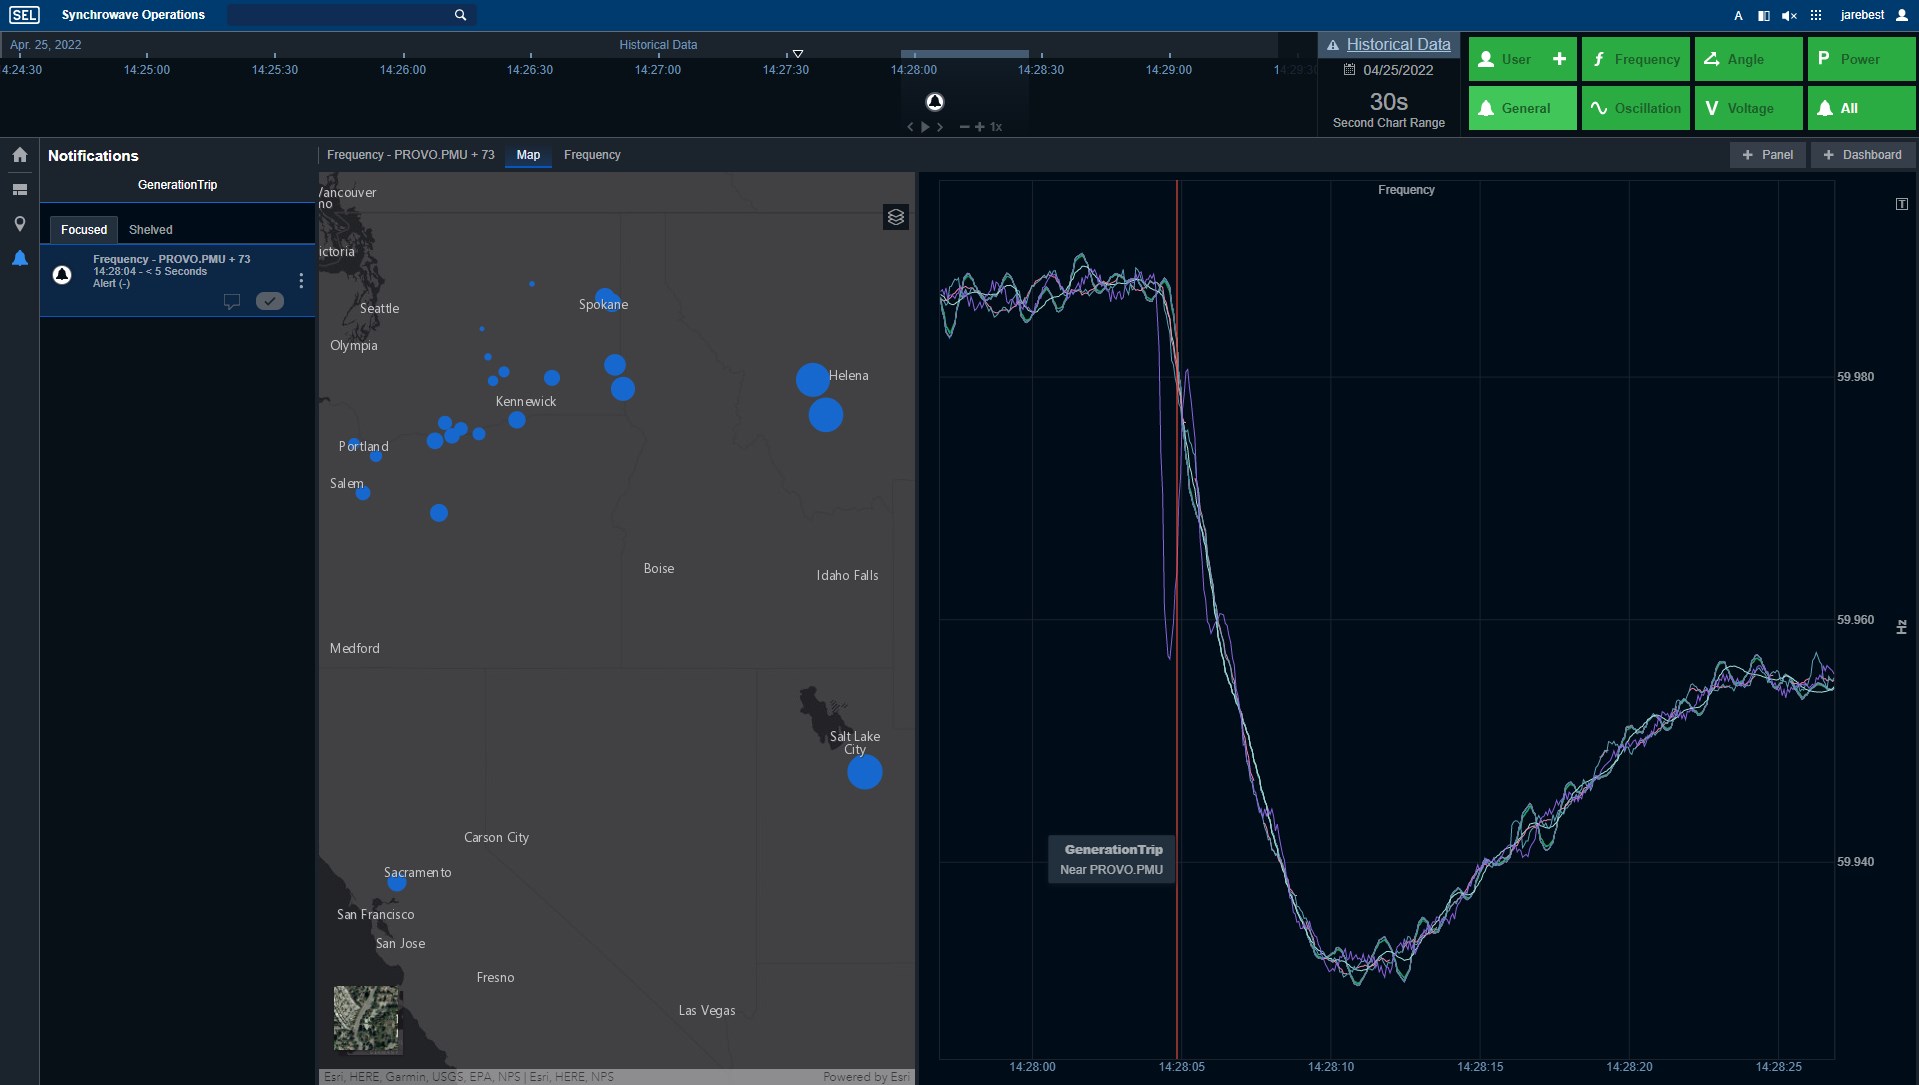
-
-
- 1
Monitor three-phase time-series voltage measurements for unexpected behavior. Use high-resolution data to detect impending failures and preemptively schedule maintenance.
- 2
Receive notifications when the instrument transformer monitor algorithm detects a potential instrument transformer failure.
12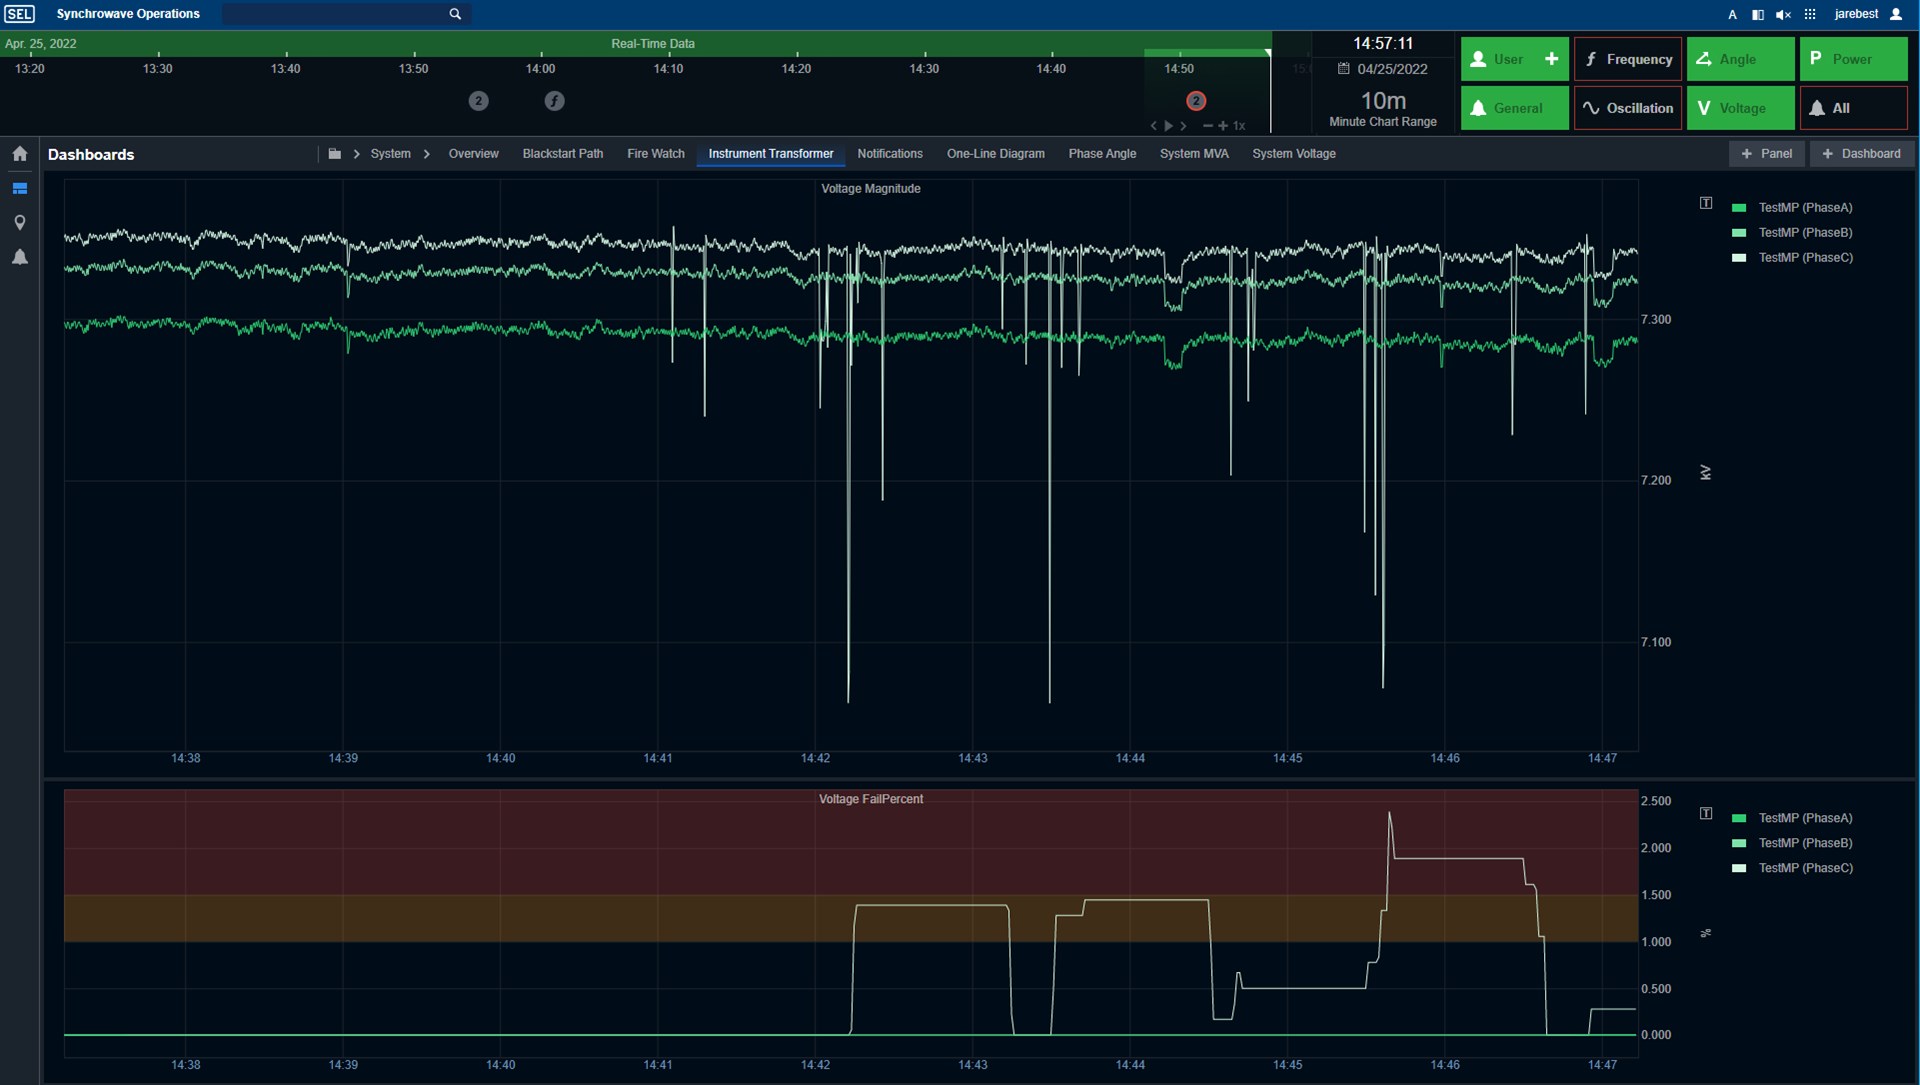
-
-
- 1
Receive a notification when an oscillation ringdown event is detected.
- 2
Analyze the oscillation via the time-series trend.
- 3
Monitor oscillation modes and their frequency, damping, amplitude, and angle via a table panel.
- 4
Quickly compare oscillation damping and amplitude to their limits with a dial panel.
1234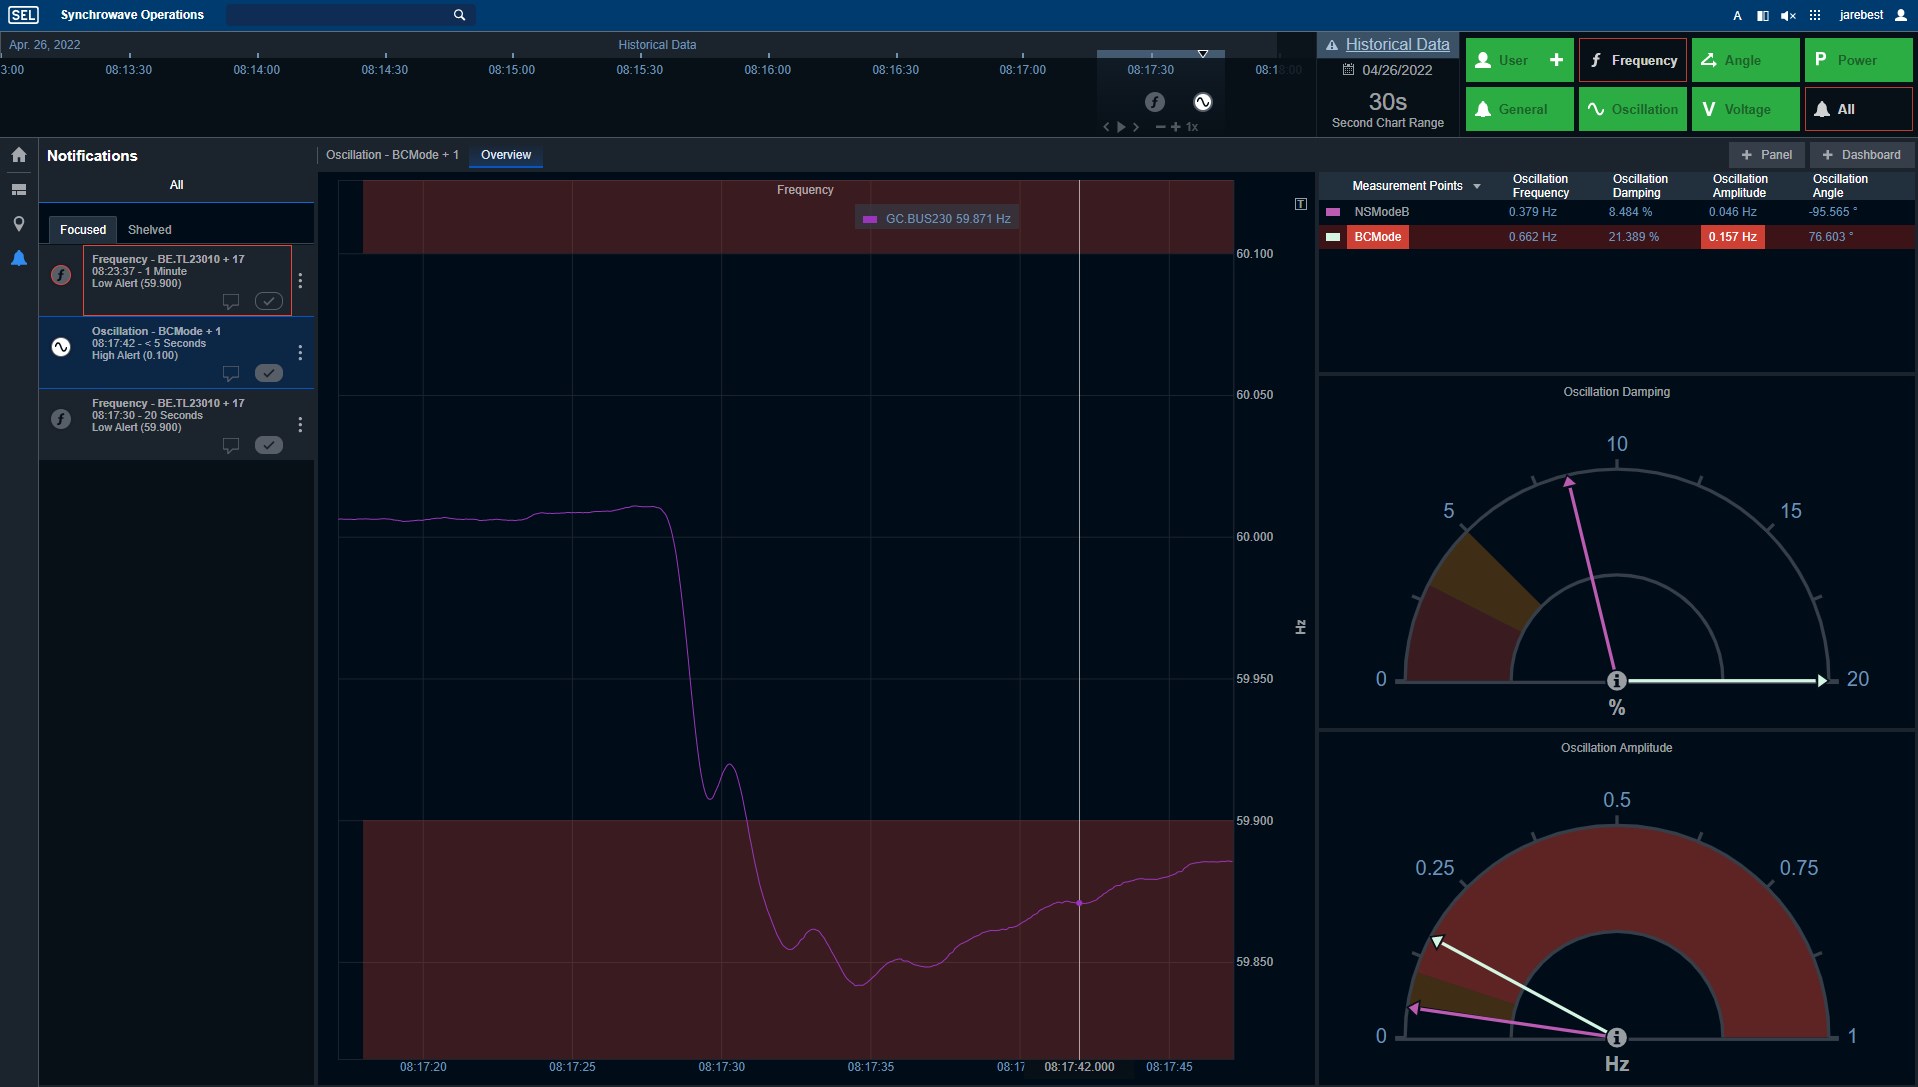
-
-
- 1
Compare direct measurements with LSE results.
- 2
Correlate measurements with topology changes.
12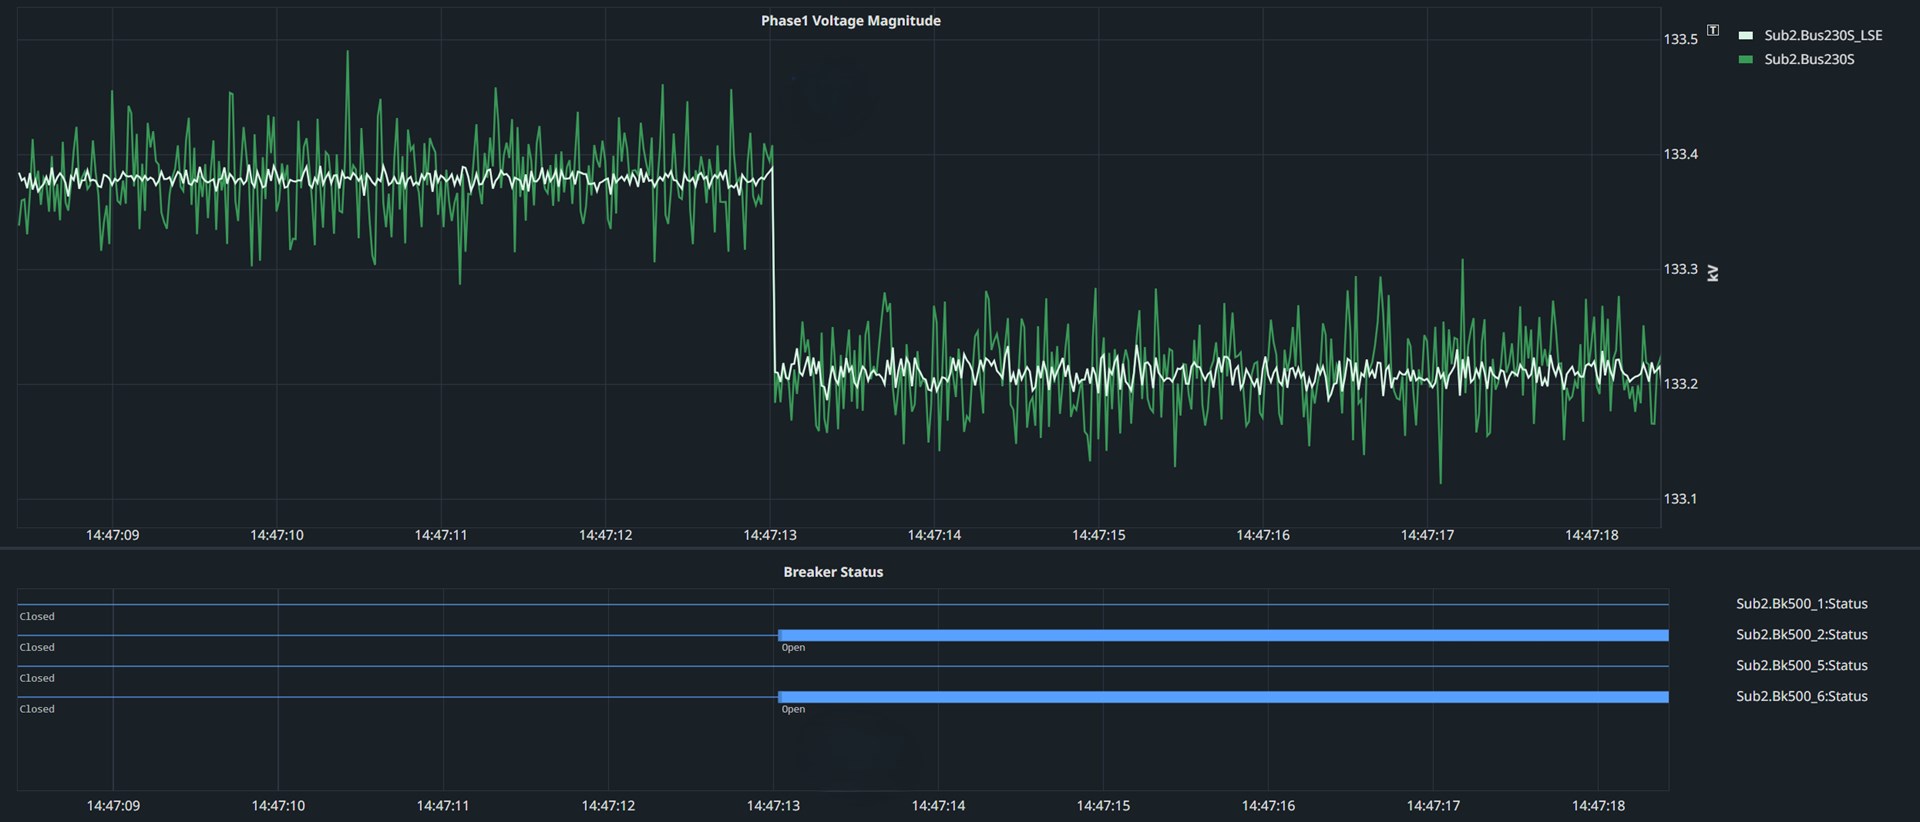
-
Details
Real-Time Analytics
Real-time applications continuously analyze data to identify power system conditions. When a condition is detected, a notification is sent to the power system operator. Notifications include critical information about the condition, such as the state, impact, and location.
The real-time applications include the following monitors:
- Frequency
- Phase angle
- Power
- Voltage
- Oscillation detection and location
- Generation loss
- Instrument transformer failure
- Disturbance
Dashboard Panels
Dashboards provide real-time visualization of power system data and information through a collection of panels:
- Time-series trend
- Esri GIS map
- Data table
- Numeric meter
- Bar chart
- Phasor scope
- Dial
- Event timeline
- XY chart
- Histogram
- One-line diagram (SVG) panel
Videos
The Firmware IDs for older versions of the firmware can typically be found in Appendix A of the instruction manual.
Sales Resource Central access is required to view the content in this tab.
Sales Resource CentralSynchrowave Operations is composed of a suite of applications for utility grid operations running on Synchrowave Platform. The applications included in the Synchrowave Operations Wide-Area Situational Awareness (WASA) application package are described below. Additional application packages for Synchrowave Operations will release in the future.
| Synchrowave Operations Applications | WASA Application Package |
| Dashboards, Notifications, and Timeline | |
| Disturbance, Frequency, Generation Loss, Instrument Transformer, Phase Angle, Power, Modal Analysis, Oscillation, and Voltage Monitors | |
| Loss Monitors | |
| Digital Chart, Time-Series Trend, Numeric Meter, and Phasor Scope Panels | |
| Trend, Table, Numeric, Dial, Bar Chart, XY Chart, and Histogram Panels | |
| Esri GIS Map Panel (Requires Esri GIS Server) | |
| One-Line Diagram (SVG) Panel | |
| Synchrowave Event Express, Device Events Timeline, acSELerator Database Reader, and Blueframe DMA Reader and Event Store | |
| Gateway Exchange Protocol (GEP) Reader, IEEE C37.118 Reader, OSI PI Reader, and IEEE 2664 STTP Reader | |
| Time-Series Historian, Data Indexer, and Data Export | |
| Calculation Engine | |
| Role-Based Access and Web Gateway | |
| Continuous Waveform Streaming (CWS) Receiver | |
| Power System Model | |
| Linear State Estimator and Network Topology Processing |
Licensing for each Synchrowave Operations application package is per streaming device. To receive a quote for your system, contact your local SEL sales representative.
5702 - Software Tab
Supporting Software
SEL Data Management and Automation (DMA) Application Suite
Available on the Blueframe platform, SEL DMA applications automatically collect, store, and manage device-specific information like oscillography, Sequence of Events (SOE) data, device settings, and property information as well as providing automated password rotation and streamlined device audits.
Learn more on the DMA software page.
SEL Compass
Compass provides simple and convenient tools for managing SEL digital content. Users can keep software applications and relay configuration drivers up to date without manually browsing product webpages as well as download new product updates and literature.
Learn more and download on the Compass software page.
Related Software
SEL-5703 Synchrowave Monitoring
Improve your understanding of system events and expedite root cause analysis with Synchrowave Monitoring software. Synchrowave Monitoring brings synchrophasor data and relay event reports together, allowing engineers to analyze both the high-level system impact of an event and detailed oscillography data.
Learn more and download on the Synchrowave Monitoring software page.


.jpg?n=63819356501000&preset=size-col-10&bp=lg)
.jpg?n=63791944811000&preset=size-col-10&bp=lg)
.jpg?n=63791944977000&preset=size-col-10&bp=lg)
.jpg?n=63791945134000&preset=size-col-10&bp=lg)


