Metering Software Solutions
Automate data collection, perform real-time power monitoring, and improve power quality analysis. Increase power system awareness using software solutions that collect, analyze, monitor, and report meter data. Select from three software bundles: the Meter Data Bundle, the Power Quality Bundle, or the Energy and Power Monitoring Bundle. Order a bundle when you purchase an SEL meter, or purchase a bundle anytime for meters already in the field.
Visualize and Analyze Power System Data
Derive more insights from meters or other devices, and analyze long-term trends based on historical data. Use interactive graphs to isolate events or specific time periods. Examine data on the web interface, or export data for further analysis.
Retrieve Reports on Demand or by Email
Generate reports on demand, or receive emails in regular intervals, including every 15-minutes, hourly, daily, weekly, or monthly. Choose between PDF or CSV file formats.
Monitor Power Quality and Confirm Compliance
Easily monitor power quality and confirm compliance with IEEE Std 519-2014, Standard for Harmonic Control in Electric Power Systems. Innovations in ac/dc and dc/ac power conversion have led to increased harmonic distortion on distribution and transmission lines, which negatively affects neighboring loads and generation sources. Monitor a single point or an entire power system for compliance, and detect distortions that cause excess heat, efficiency loss, system capacity reduction, and other problems.
Automate Data Collection
Accelerate root-cause analysis and reporting by automating the aggregation of voltage sag, swell, and interruption (VSSI); load data profile (LDP); Sequential Events Recorder (SER); and event data from meters.
Optimize Your System
Visualize and report system-wide meter data, including VSSI data, LDP information, SER data, and water, air, gas, electricity, and steam (WAGES) consumption details. Use meter data to validate usage patterns and identify areas for improvement, such as avoiding peak demand charges by moving overlapping electric processes to off-peak hours. ITI (CBEMA) curves and detailed voltage event tables help you recognize power disturbance issues before they affect equipment.
Monitor Power in Real Time
Monitor the real-time state of the power system using streaming measurements for key system and facility assets. As power system generation and load become more dynamic, high-rate data help identify hidden equipment failures and inefficiencies early to improve reliability and uptime.
System Architecture
Collect LDP, VSSI, Sequence of Events (SOE), and event data, and stream synchrophasor and continuous waveform data from SEL meters using SEL software for analysis, monitoring, and reporting.
Bundling Options
Based on your needs, select from one of three software bundle options: the Meter Data bundle, the Power Quality bundle, or the Energy and Power Monitoring bundle. Order a bundle when you purchase an SEL meter, or purchase a bundle anytime for meters already in the field. See the Features section to learn about the capabilities of each software bundle. Review the Licensing section for a complete table comparing features available in each software bundle.
Meter Data BundleThe Meter Data bundle includes the basics for automated SEL-735 Power Quality and Revenue Meter data collection and general reporting on interval data or captured oscillography events.Use interactive charts and reports to quickly identify trends and opportunities for improvement and validate usage patterns. In just a few steps, you can easily export and email reports in PDF or CSV format.
Power Quality BundleThe Power Quality bundle offers all Meter Data reports and adds an IEEE 519 compliance report, which streamlines power quality compliance monitoring.A license for SEL-5703 Synchrowave Monitoring is also included in this bundle. Synchrowave Monitoring receives streaming data via a phasor measurement unit (PMU) or continuous waveform streaming (CWS) device. For applications such as virtual metering, you can visualize data in real-time dashboard plots processed by the internal calculations engine. Export data for further analysis in third-party software.
Energy and Power Monitoring BundleThe Energy and Power Monitoring bundle is the most feature-rich and capable software bundle. It brings together all the capabilities of interactive charts, power quality reporting, and continuous waveform analytics, and it adds alarming and detection for streaming data. This software bundle is a valuable tool for engineers and data scientists who are developing the latest detection algorithms for events such as subsynchronous oscillation and early PT failure.
Metering Software Solutions Features
1
2
3
4
5
6
- Included in the following bundleEnergy and Power Monitoring
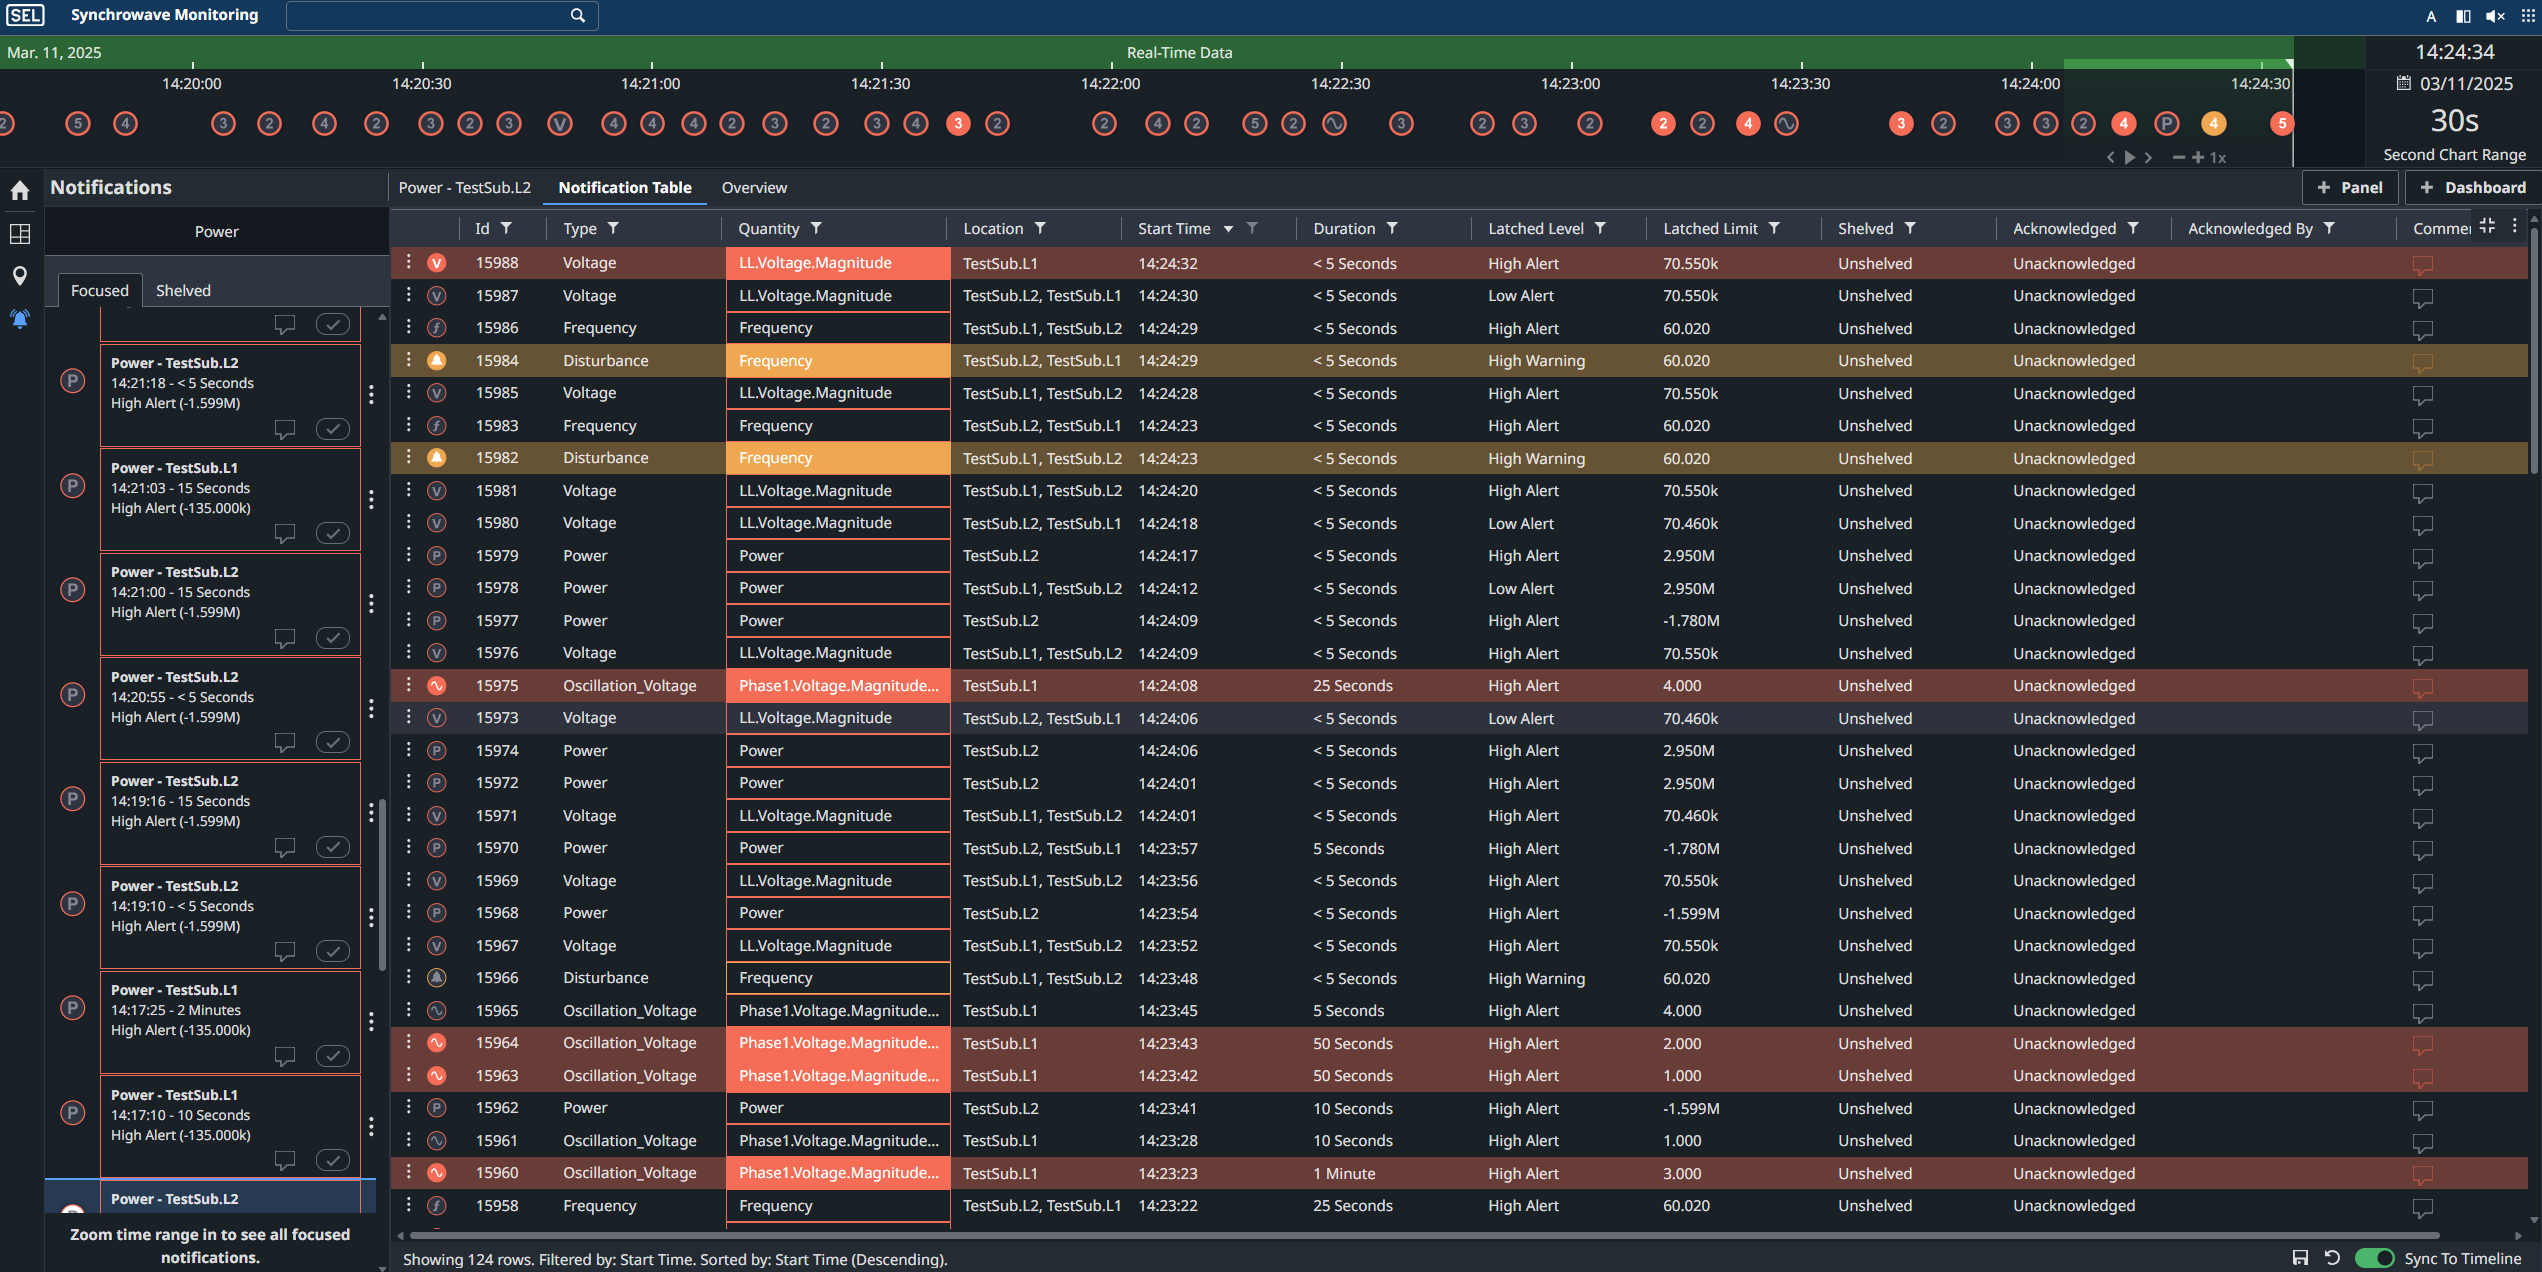
- Alarms and AlertsReceive notifications of any issues or anomalies present in the power system. Configure custom warning and alert thresholds to quickly address issues.
- Oscillation and DetectionReal-time monitoring helps operators immediately recognize oscillatory conditions and respond to potentially abnormal power system conditions.
- Disturbance DetectionBecause the software continuously monitors the power system, operators can quickly identify any deviations from normal conditions and take corrective action to maintain grid reliability and stability,
- CalculationsDefine and execute user-defined calculations on continuous waveform and PMU measurements.
- Power System ModelingAssociate signal measurements with power equipment. Use Geographic Information System (GIS) data and nominal voltages to connect stations, buses, and lines for monitoring and analysis.
1
2
3
4
5
- Included in the following bundles- Power Quality
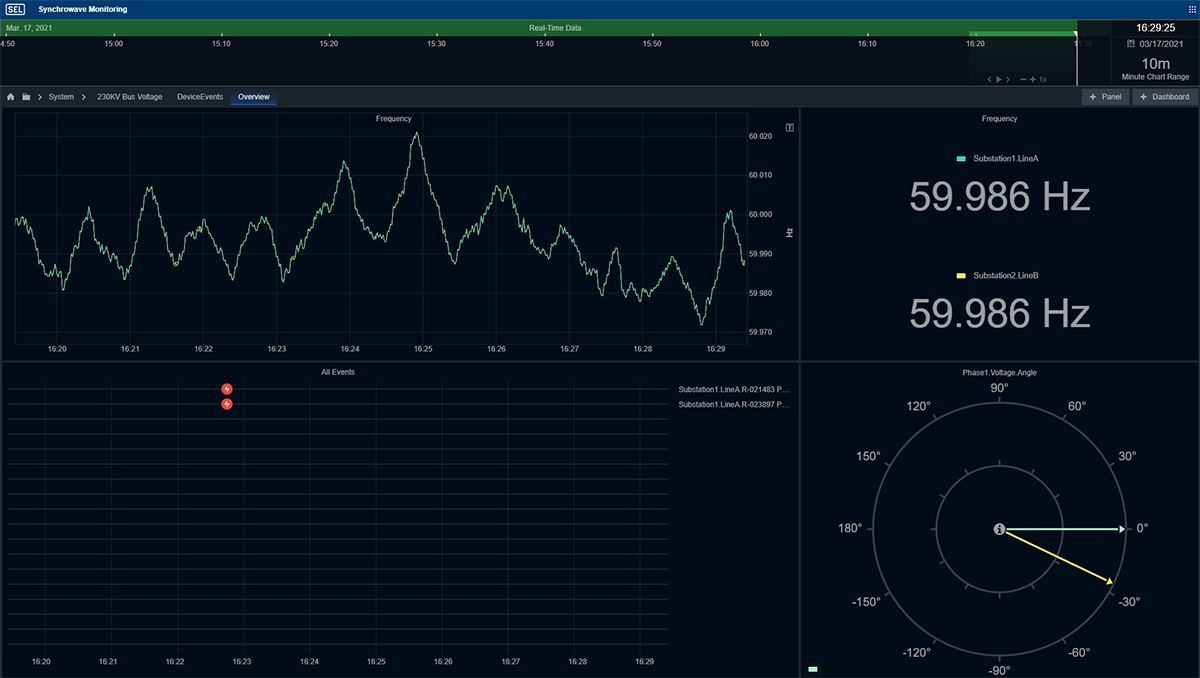
- Energy and Power Monitoring - TrendingCompare real-time and historical trends.
- Relay EventsCorrelate relay event records to the system response. Select the event report to see the relay oscillography.
- Phasor ScopeVisualize phase angle separation between measurements to determine system stress.
- TimelineUse the timeline to seamlessly transition between real-time and historical data.
1
2
3
4
5
- Included in the following bundles- Power Quality
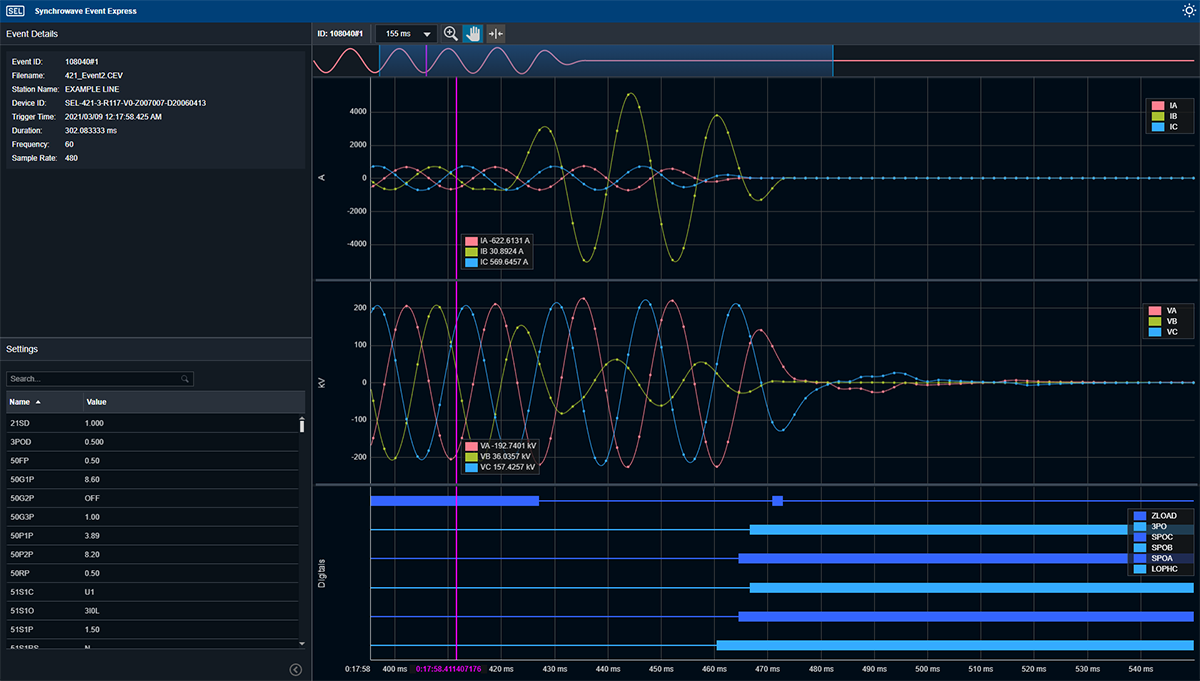
- Energy and Power Monitoring - Event SummaryView event report summary information.
- OscillographyVisualize the trending of relay oscillography.
- DigitalsView the status of the Relay Word bits state with respect to time.
- Relay SettingsSee the state of relay settings at the time of the event report trigger.
.png?content_type=image%2Fpng)
1
2
3
- Included in the following bundles- Power Quality
- Energy and Power Monitoring - High-resolution dataVisualize waveforms at 3.0–14.4 ksps to capture fast transients and high-frequency disturbances.
- Enhanced power quality monitoringThe detailed monitoring of disturbances and abnormal conditions helps engineers and operators proactively maintain grid reliability and stability.
1
2
3
4
5
- Included in the following bundles- Meter Data
- Power Quality
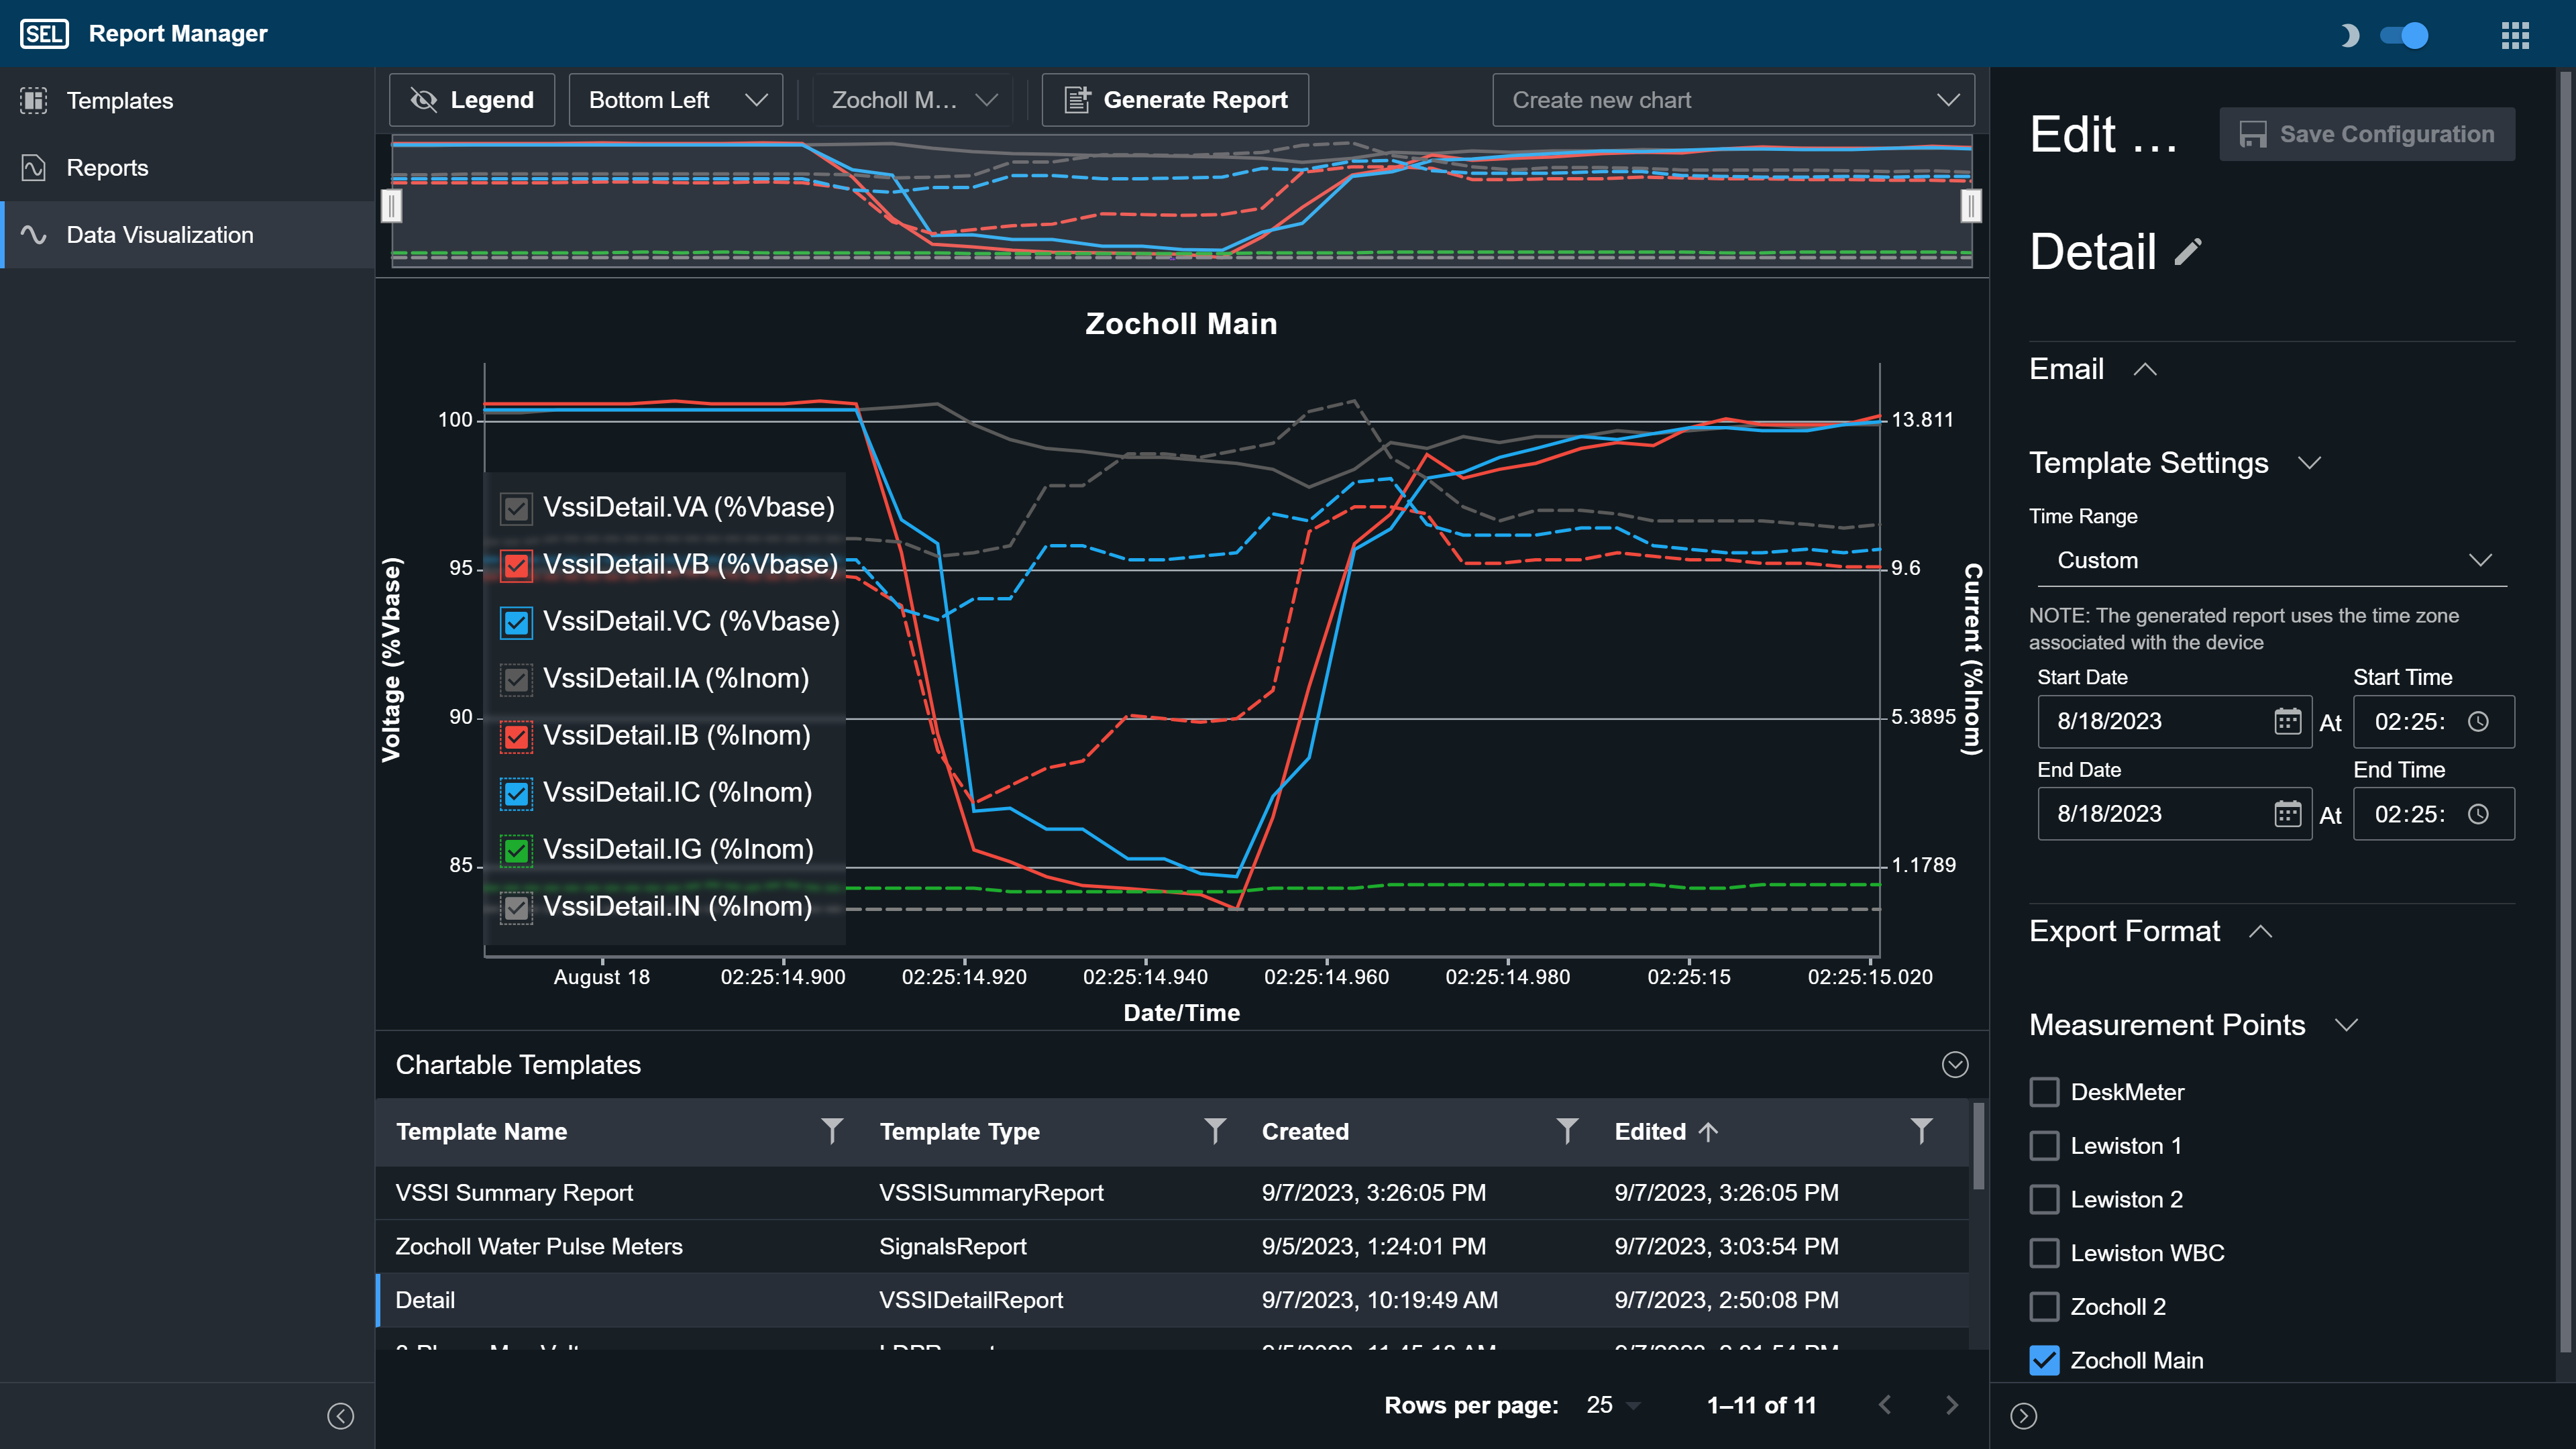
- Energy and Power Monitoring - Easily visualize metering data collected by Synchrowave Reports by using the web interface.
- Select a chart template for any configured reports.
- Adjust the time range for a visualization to focus on specific events or other areas of interest.
- Export data from the current visualization for further analysis or record keeping.
1
2
3
4
- Included in the following bundles- Meter Data
- Power Quality
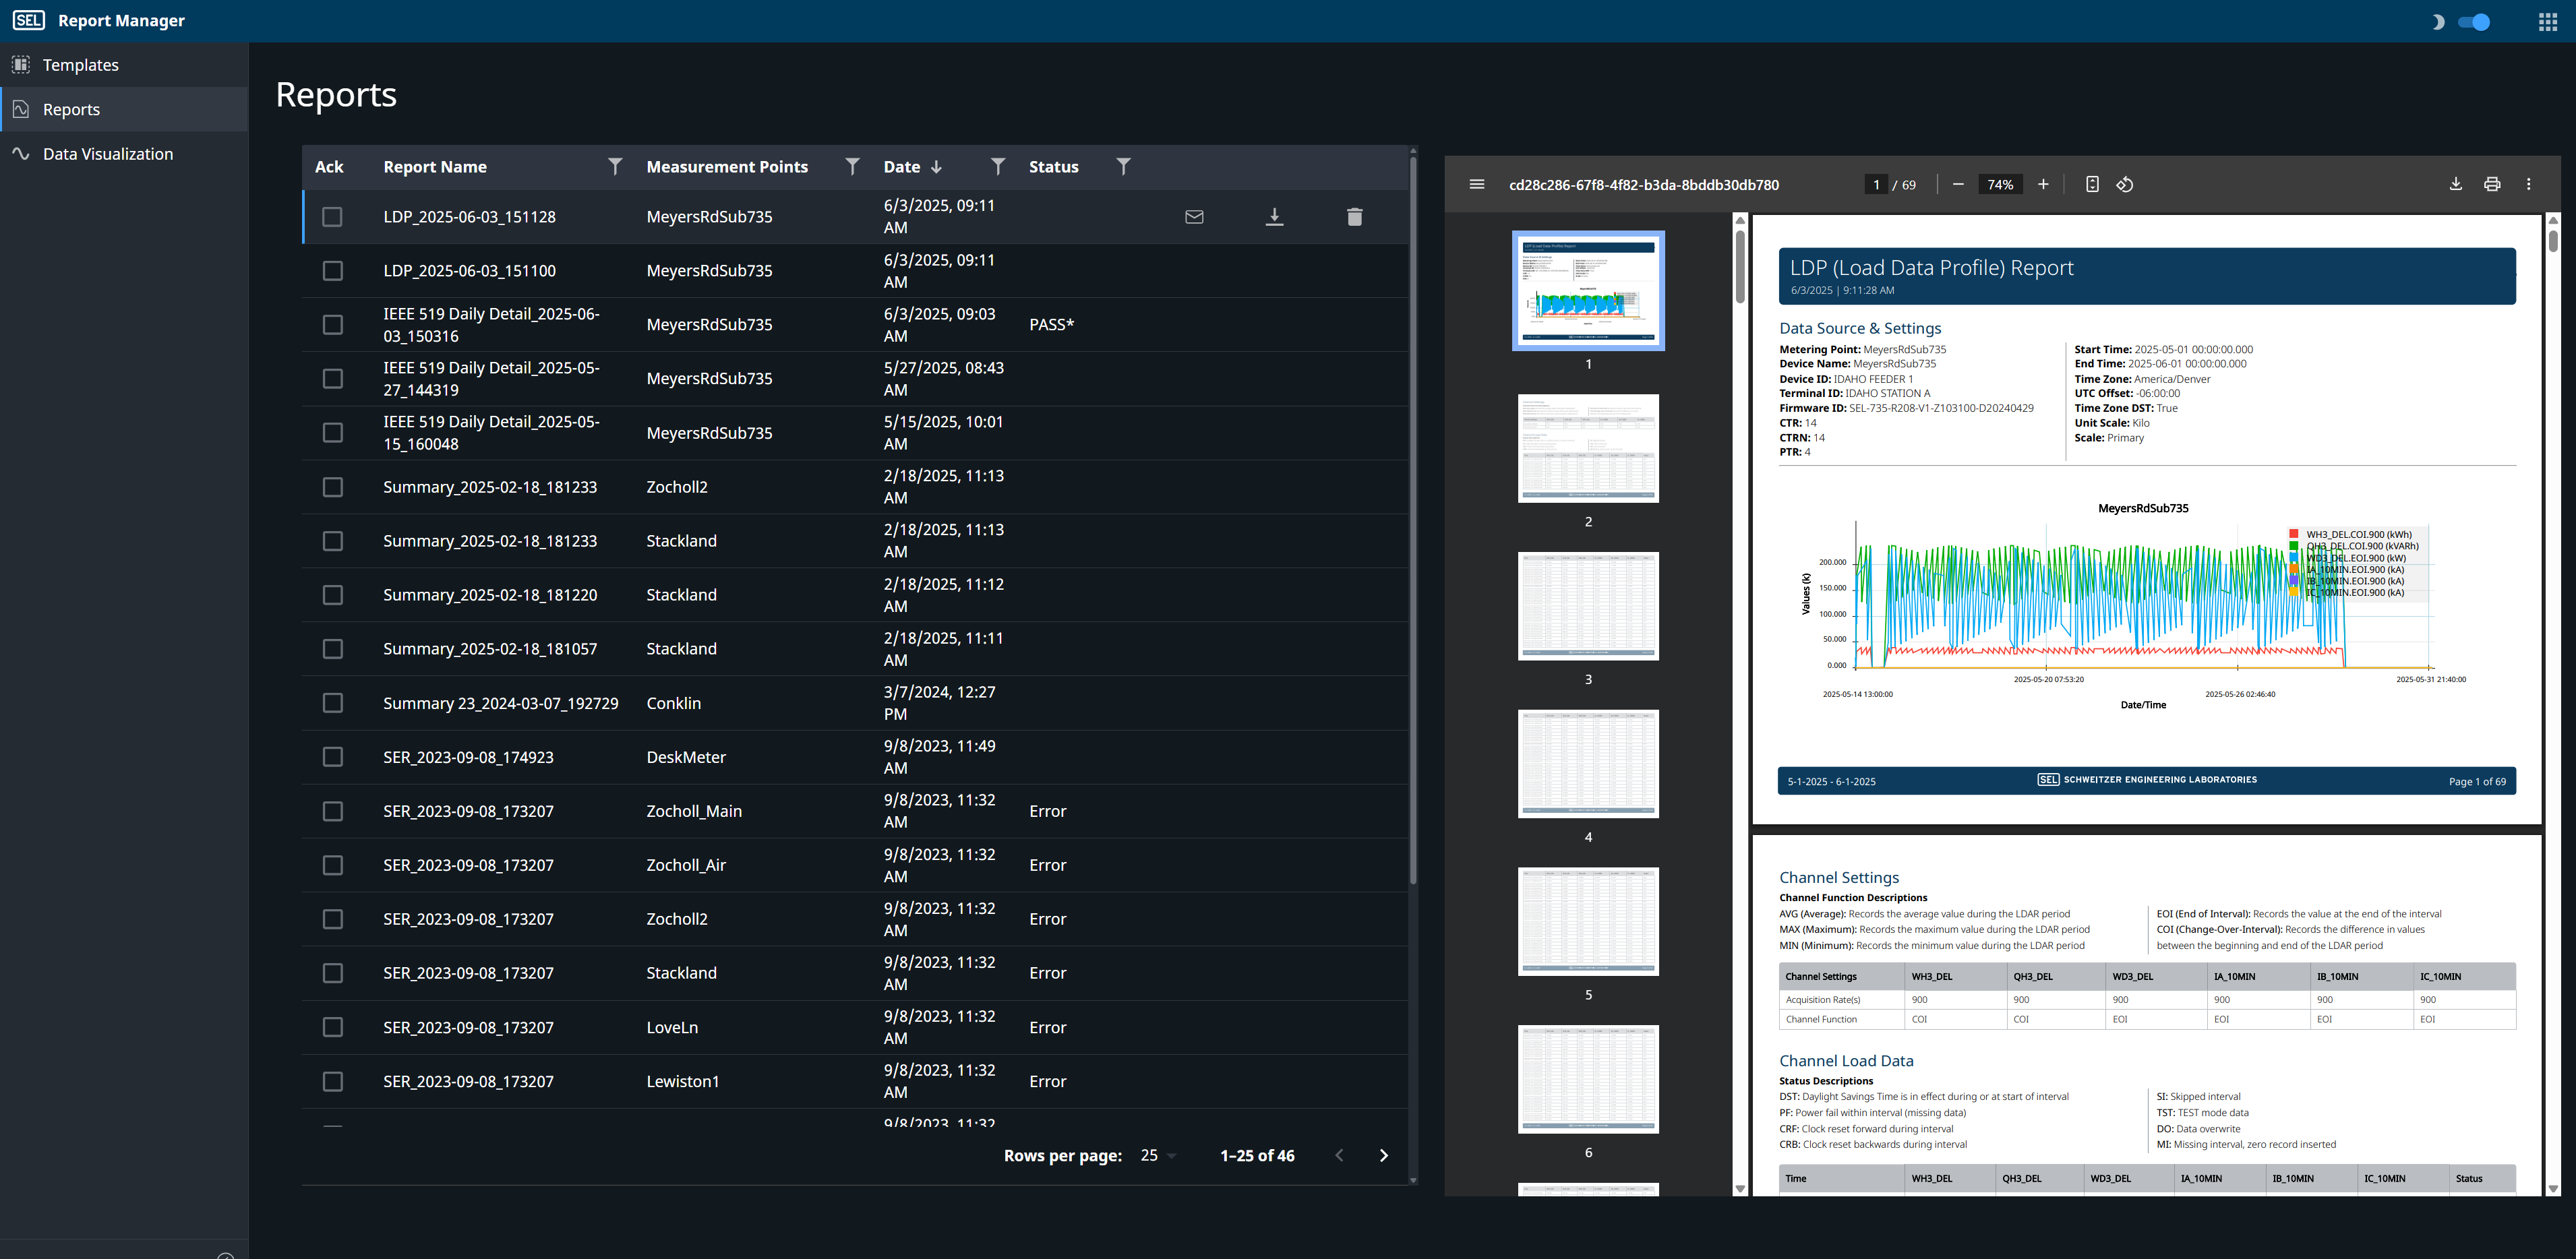
- Energy and Power Monitoring - Predesigned reports styled for readability make it easy for operators to quickly find the data they need.
- Visualize the health of your power system using intuitive, time-stamped charts.
- PDF reports include tabular data and keys to support data analysis and interpretation.
1
2
3
4
- Included in the following bundles- Meter Data
- Power Quality
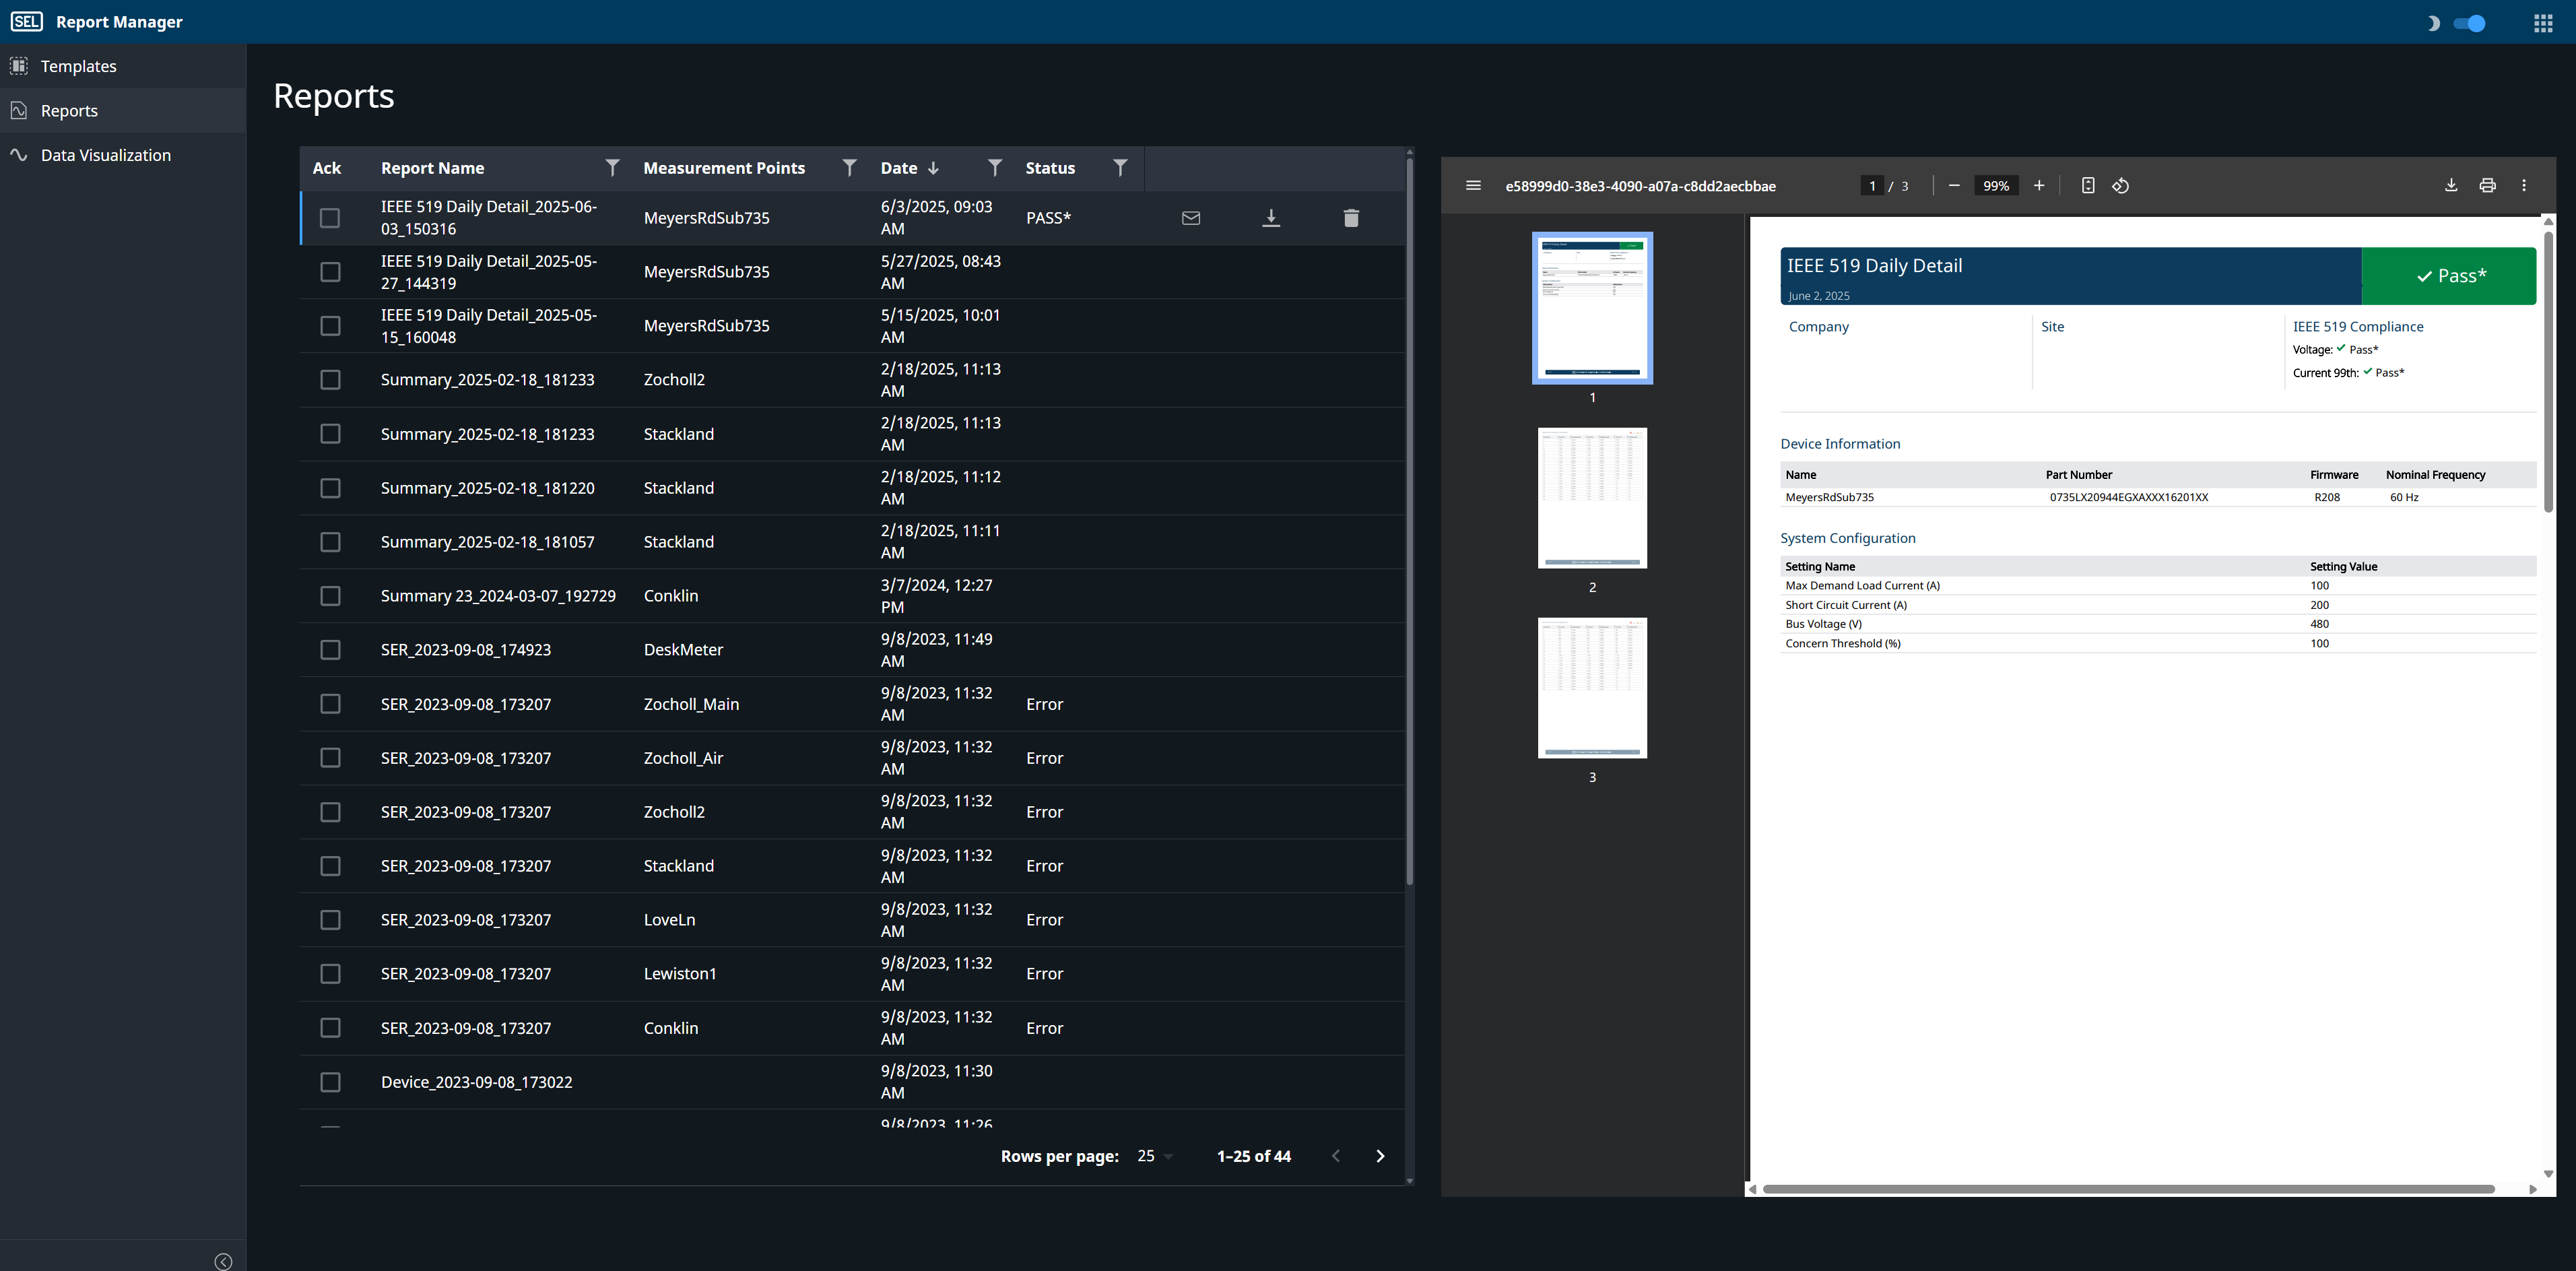
- Energy and Power Monitoring - Quickly confirm compliance using color-coded pass and fail indicators.
- Review individual measurement levels up to the 63rd harmonic for greater awareness and diagnosis.
- Generate and subscribe to detailed daily or weekly reports.