The nature of the power system is changing. Renewable generation, among other factors, is introducing more complex power system dynamics that utilities must monitor to preserve stability. Meanwhile, reliability expectations continue to increase. For these reasons, it is critical to equip transmission control centers with tools to transform time-synchronized data into detailed system insights that support their decision making.
SEL-5702 Synchrowave Operations, SEL’s next-generation wide-area situational awareness (WASA) software, responds to this challenge. It complements SCADA and energy management systems (EMSs) by aggregating high-resolution time-series data, including synchrophasor data, relay event reports, point-on-wave data, and GIS geospatial data. Learn how a U.S. utility collaborated with SEL to develop this innovative software.
Try the software now to see live synchrophasor data from across the United States, and request a free, personalized consultation with an SEL software expert.
Turn High-Resolution Data Into Actionable Insights
Improve your real-time system visualization and monitoring. Enhance your team’s decision-making abilities during abnormal conditions. As WASA or wide-area monitoring system (WAMS) software, Synchrowave Operations aggregates, organizes, and presents high-resolution time-series data as actionable information for control center operators and operations engineers.Supplement SCADA Systems
Synchrowave Operations is a powerful complement to SCADA and EMS software; it captures critical power system dynamics that are too fast to see at traditional SCADA rates. Visualize and monitor your system using several types of high-resolution time-series data, including phasor measurement unit (PMU) data, relay event reports, point-on-wave data, and GIS geospatial data. GIS data includes a map with overlays of assets (such as substations and transmission lines), weather data, and wildfire data.Navigate Using a Modern Interface
As a next-generation software solution, Synchrowave Operations offers an intuitive, modern interface. Customize dashboards with a variety of panels (such as time-series trend, Esri GIS map, data table, numeric meter, and bar chart). Seamlessly transition between a wide-area view of your system and asset-specific information. Easily zoom and pan across a timeline to review historical and real-time data and navigate directly from the timeline to detailed event information.Understand Your System In Depth
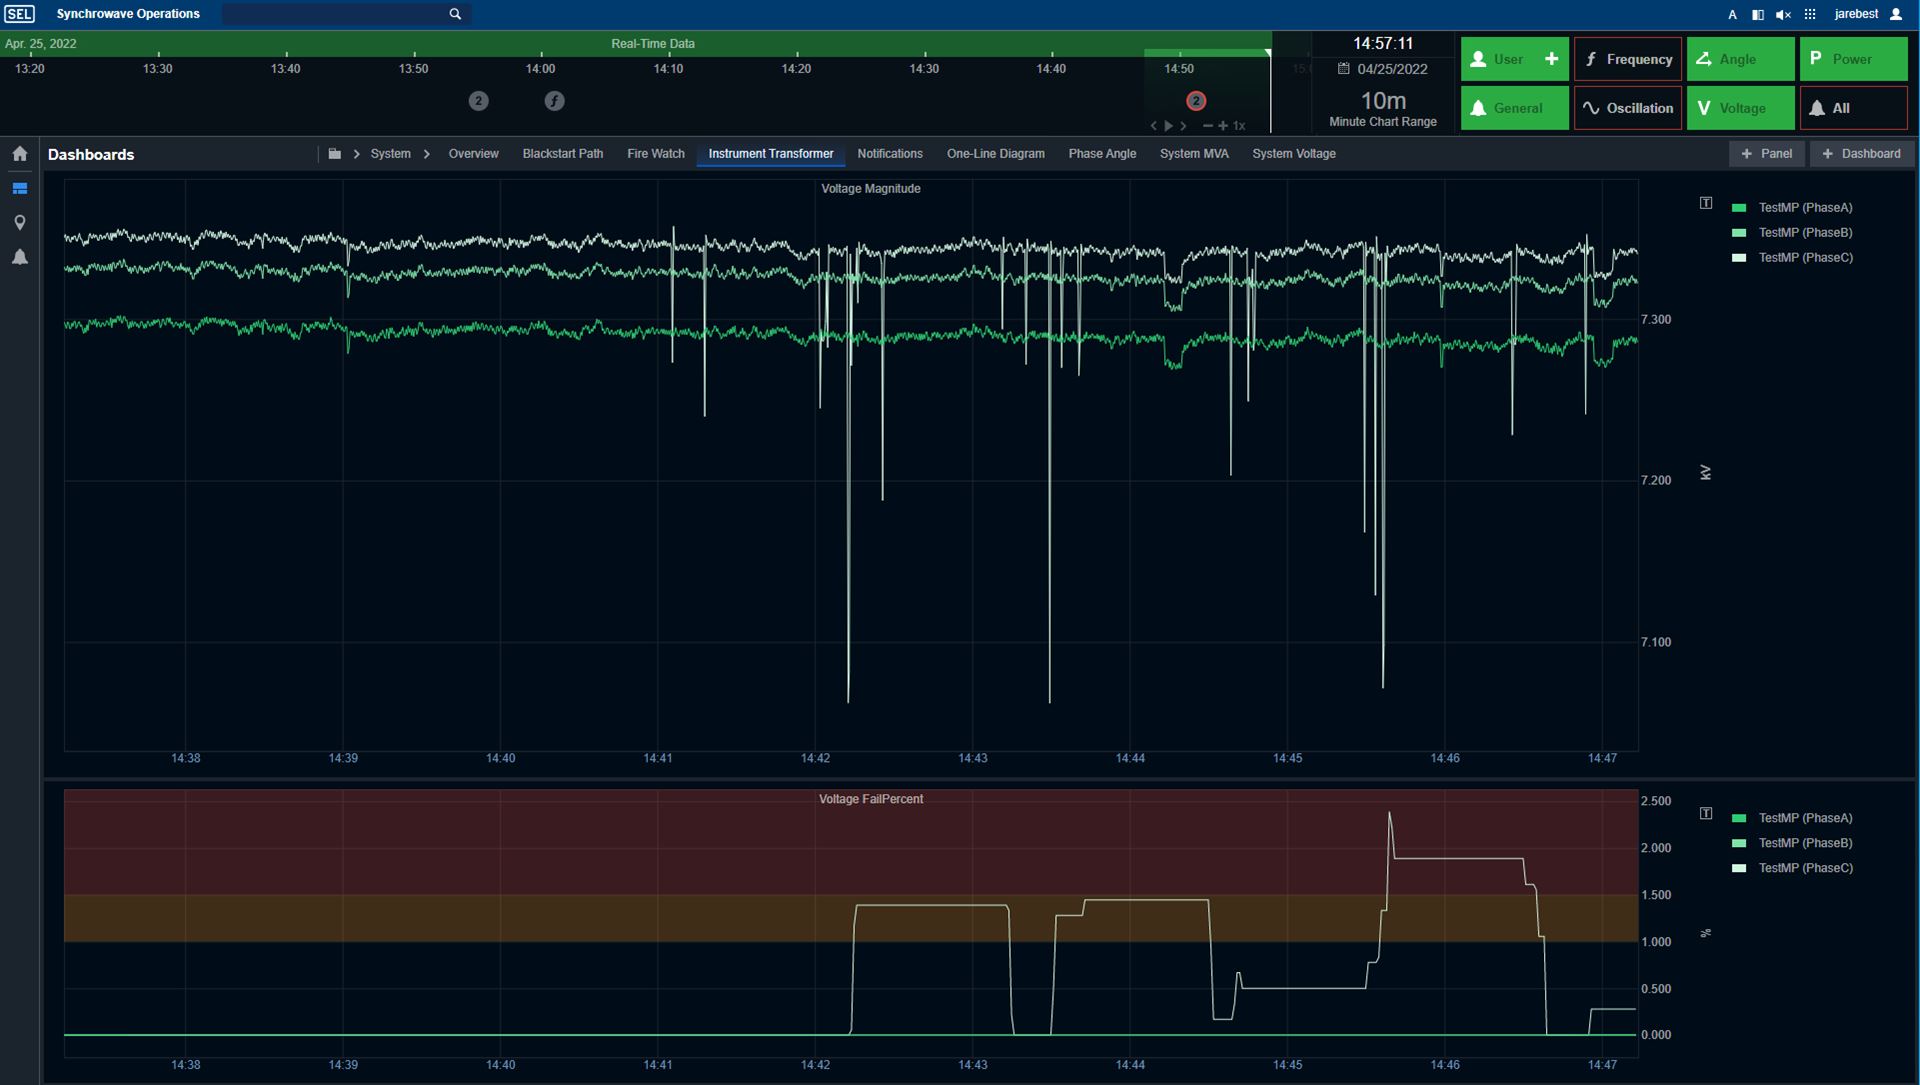
- Prevent Impending PT Failures—Use Synchrowave Operations’ high-resolution data to automatically detect and alert you to incipient PT failures, giving you time to schedule preventative maintenance for your equipment.
- Analyze the Impact of Renewables—Easily access and archive time-stamped data from remote renewable generation sites to track performance and analyze events such as frequency response, undesired oscillations, and more.
- Receive Intelligent Alerts—Get immediate notifications of power system disturbances based on frequency, angle, oscillation, power, voltage, and other thresholds. Alerts are intelligently grouped by event to streamline the notifications you receive.
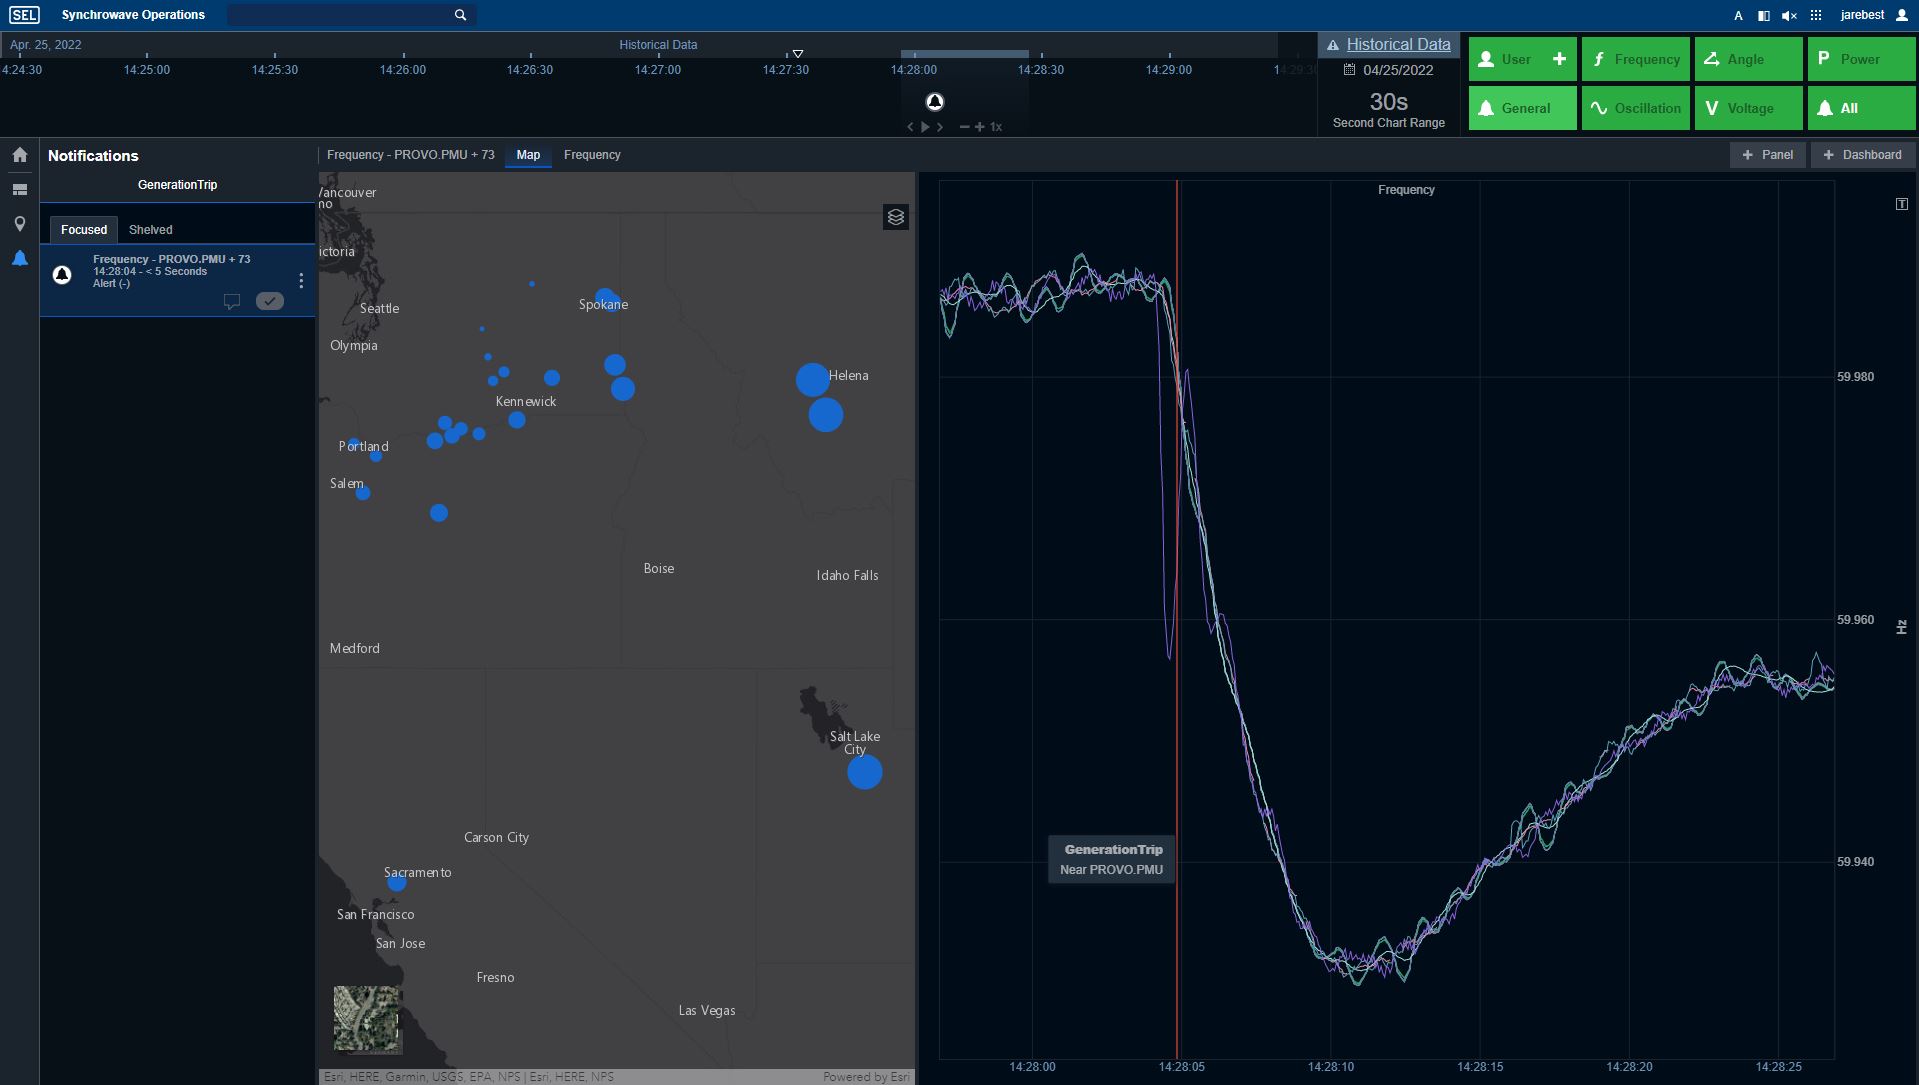
- Detect and Locate Generation Loss—Easily visualize generation loss events with Synchrowave Operations’ geospatial display, which allows users to quickly determine the PMU closest to the event location. A visual overlay also labels event and locational information directly on the real-time trend panel, providing immediate insights.
- Monitor System Stress—View real-time and historic phase angles across your system via a phase-angle overview diagram. The phase-angle monitor automatically computes the phase-angle difference (PAD) across transmission lines and generates a notification when the PAD for a transmission line exceeds its limit.

