Wide-Area Monitoring System (WAMS)
The Blueframe WAMS solution provides powerful visualization and analysis tools for operations control centers, delivering actionable insights that complement traditional energy management systems (EMSs) and SCADA systems. Improve system visibility with real-time analytics by using high-resolution time-series data, including synchrophasors, oscillography, continuous waveform streams, and geographic information system (GIS) data.
Request a no-cost demonstration from our technical experts, or purchase and download today.
What’s New
New features and enhancements to SEL software are released on a regular basis. For the most recent updates, see the Latest Versions section and read the detailed release notes.
Key Benefits
Analyze Real-Time and Historic Data
Quickly transition from real-time dashboards to historic event analysis.
Detect and Locate Oscillations
Monitor inverter-based resource generation and dynamic large loads for potential oscillations.
Improve Situational Awareness
Continuously monitor power system state with high-resolution data.
Take a Closer Look
Monitor Your Power System
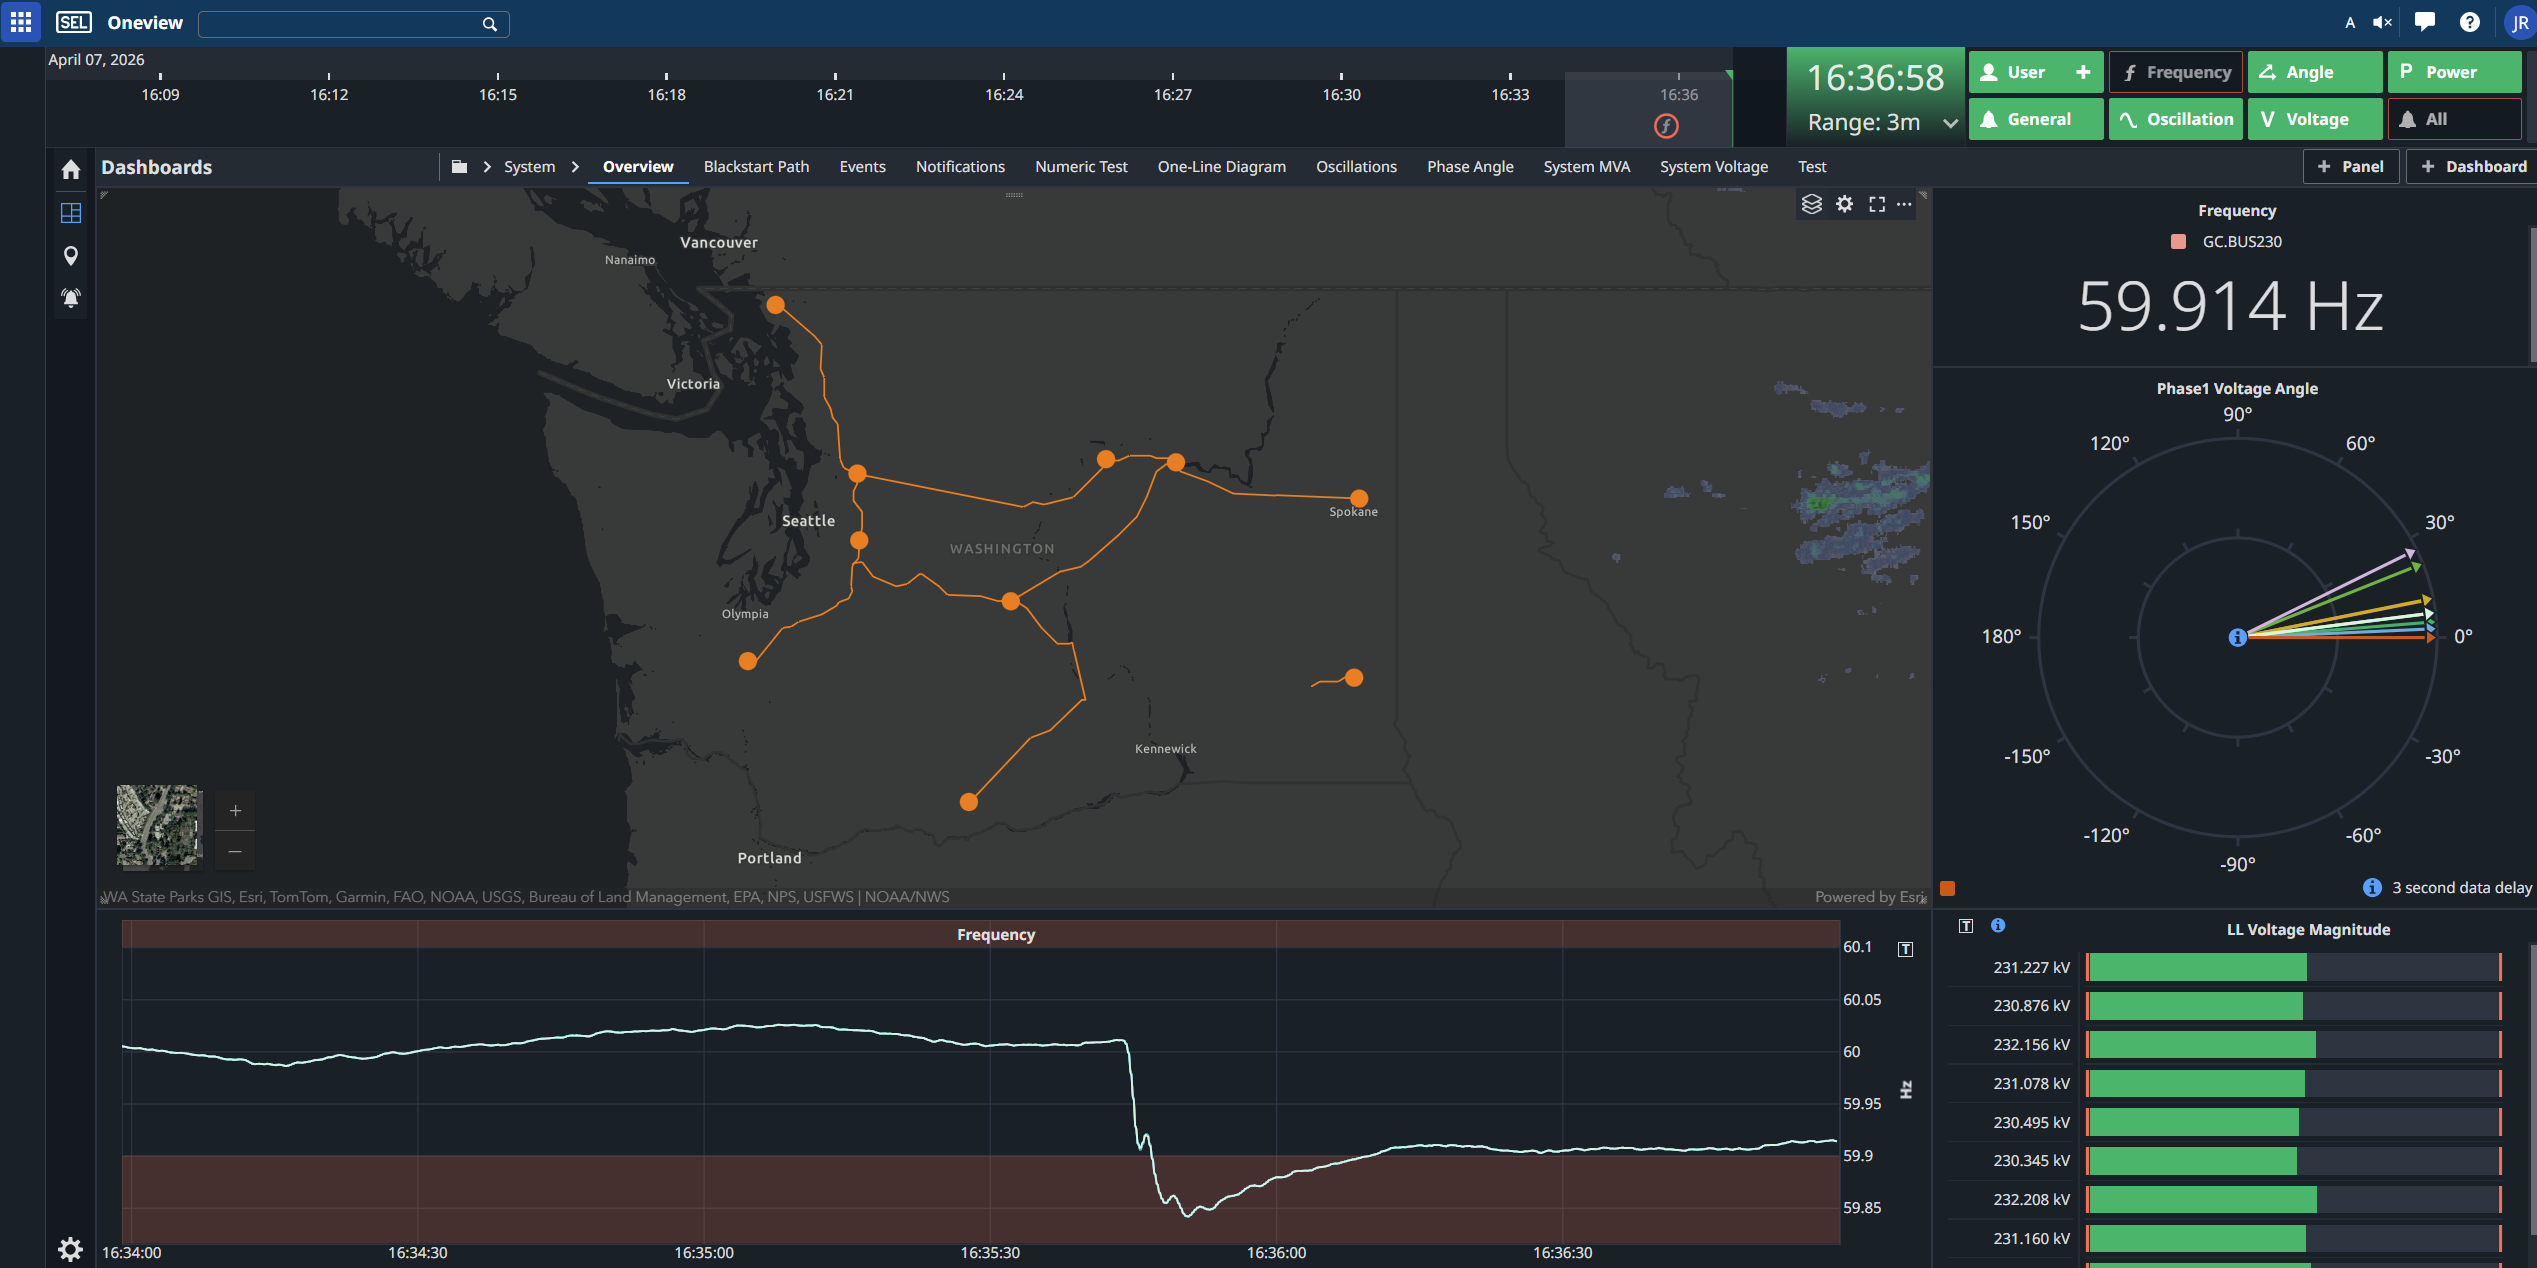
Visualize live, subsecond, and time-aligned information from across your system. Enhance situational awareness by aggregating data types, including synchrophasors, event reports, continuous waveform streams, GIS, and streaming. Monitor frequency, phase angle, power, and voltage measurements to assess the health of your system and enhance decision-making during abnormal conditions.
Complement SCADA and EMS Software
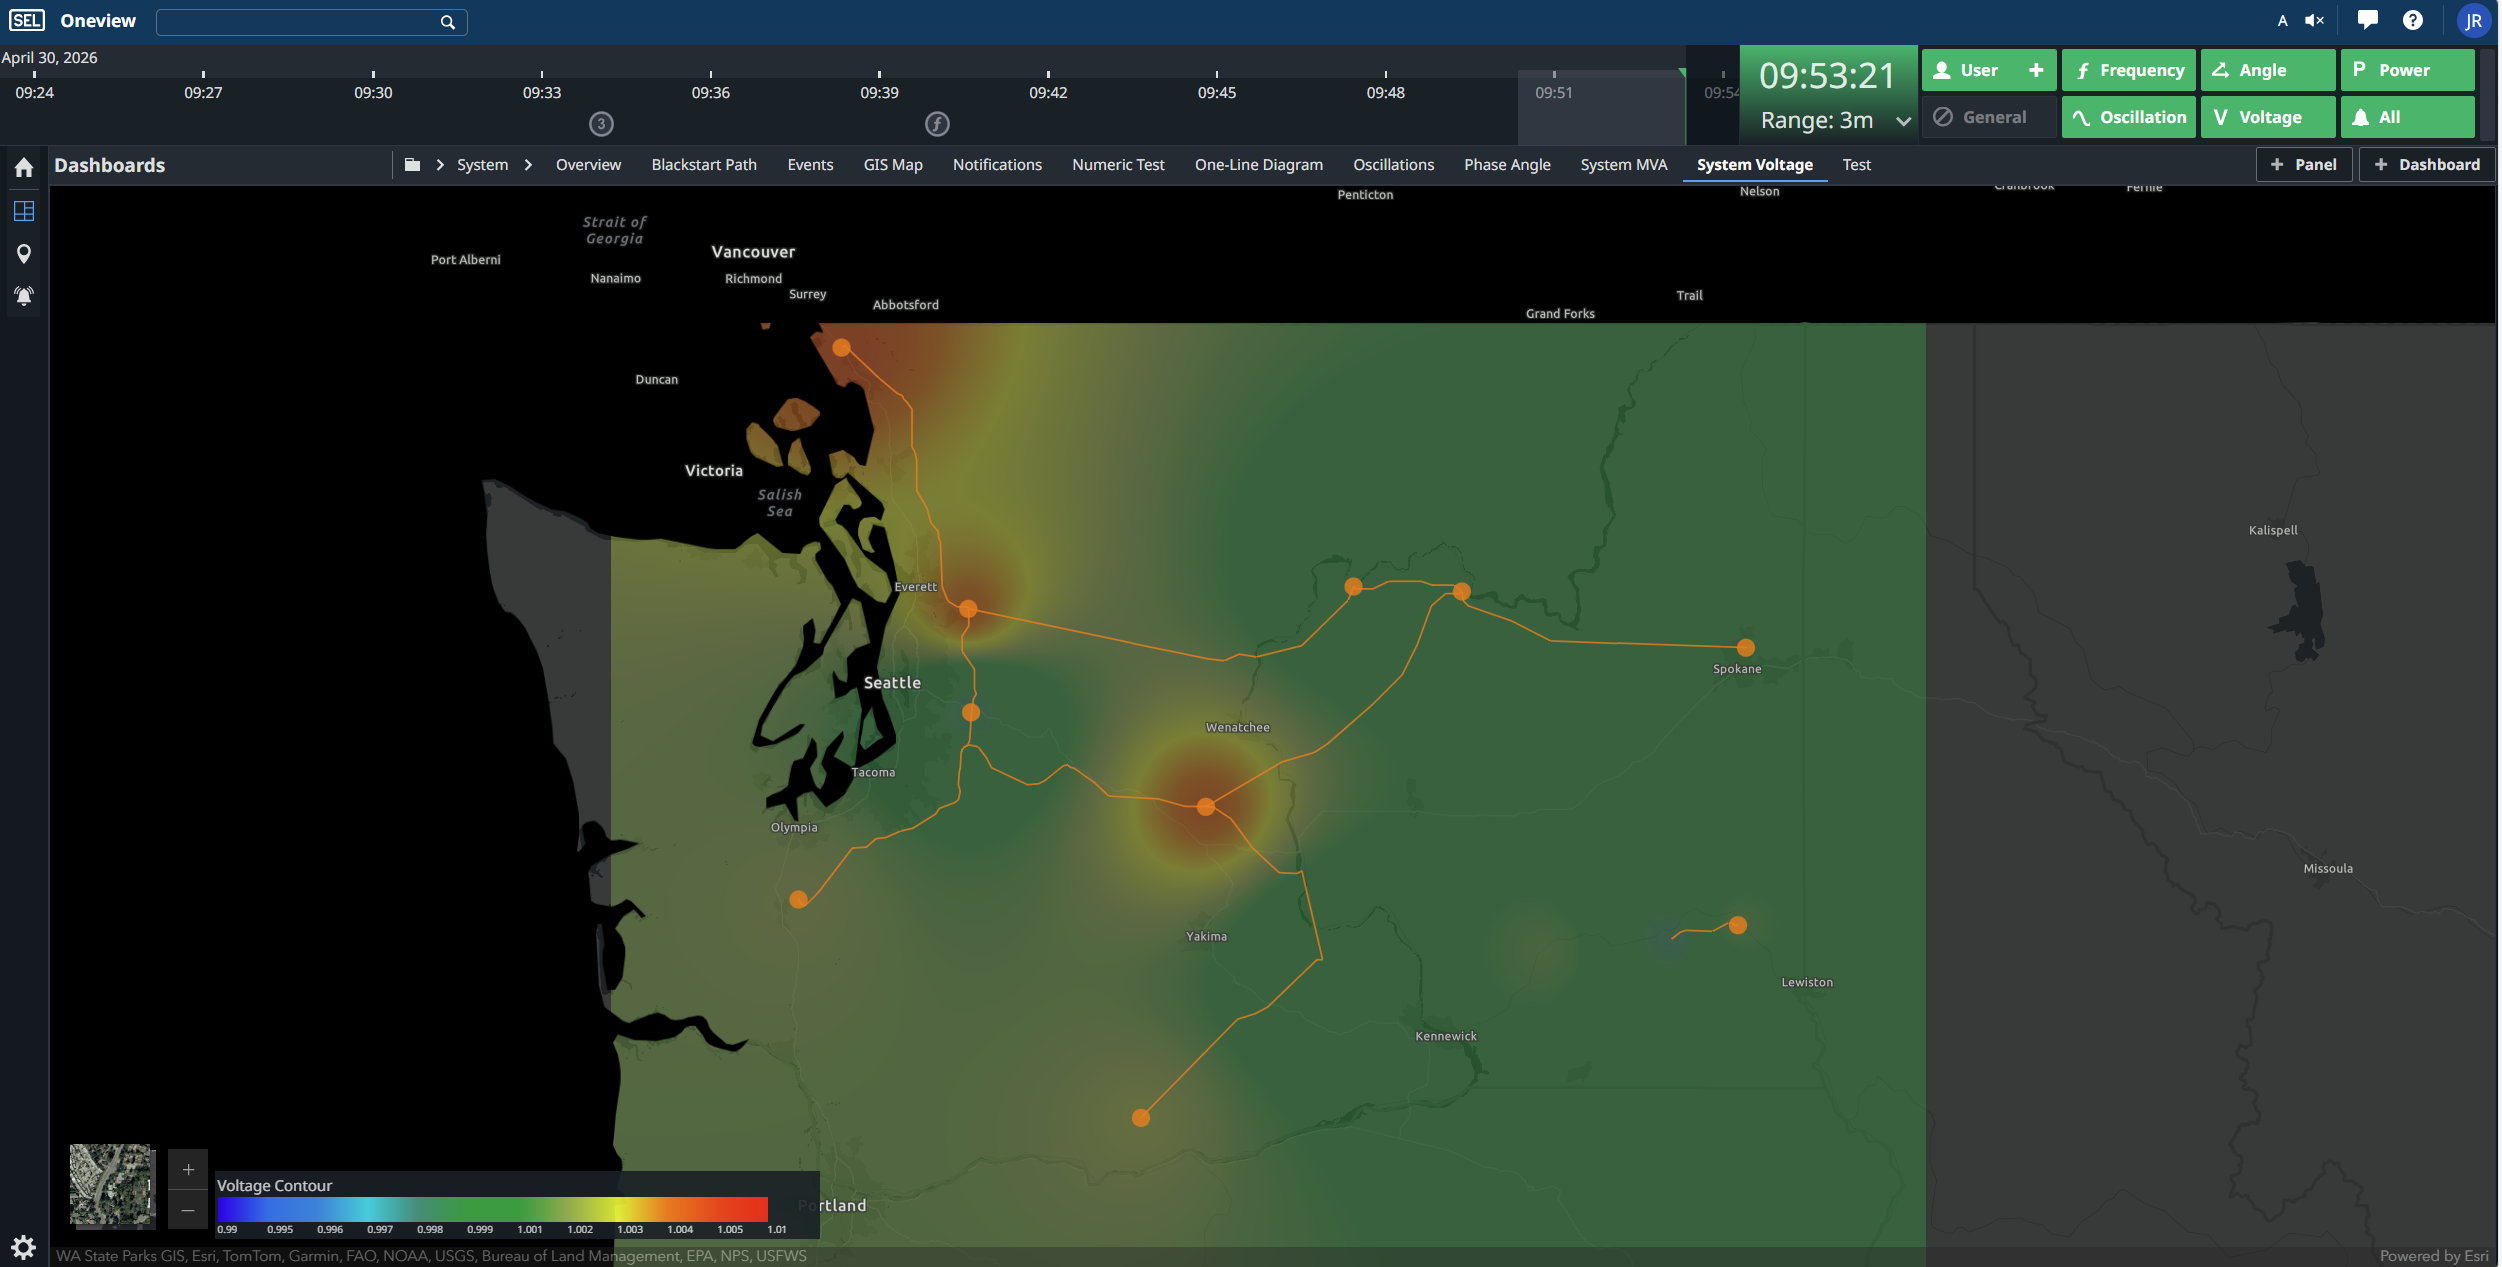
Monitor your system using high-resolution time-series data, including phasor measurement unit (PMU) data and continuous waveform streams, to capture critical power system dynamics that are too fast for traditional SCADA rates. In addition, continuous waveforms capture every disturbance, eliminating predefined triggers required in most EMS configurations. Visualize assets—such as substations and transmission lines—along with weather and wildfire data on a GIS map.
Analyze Individual Assets
Drill down to examine individual assets, such as substations and transmission lines. Visualize real-time and historic data for each asset, see its geospatial location, and monitor breaker status information. Automatically detect and alert on impending PT failures to support preventative equipment maintenance.
Investigate Disturbances and Receive Intelligent Alerts
Analyze disturbances with subcycle resolution. Real-time analytics applications constantly monitor streaming data and provide notifications that give the operator access to key event data, including the location and impact, with a single click.
Assess the Impact of Renewables
Easily access and archive time-stamped data from remote renewable generation sites to track performance and analyze events such as frequency response and undesired oscillations.
Detect and Locate Generation Loss
Plot generation loss events on a geospatial display to quickly determine the PMU closest to the event location. Overlay visual markers and location data directly on the real-time trend panel for immediate insights.
Monitor System Stress
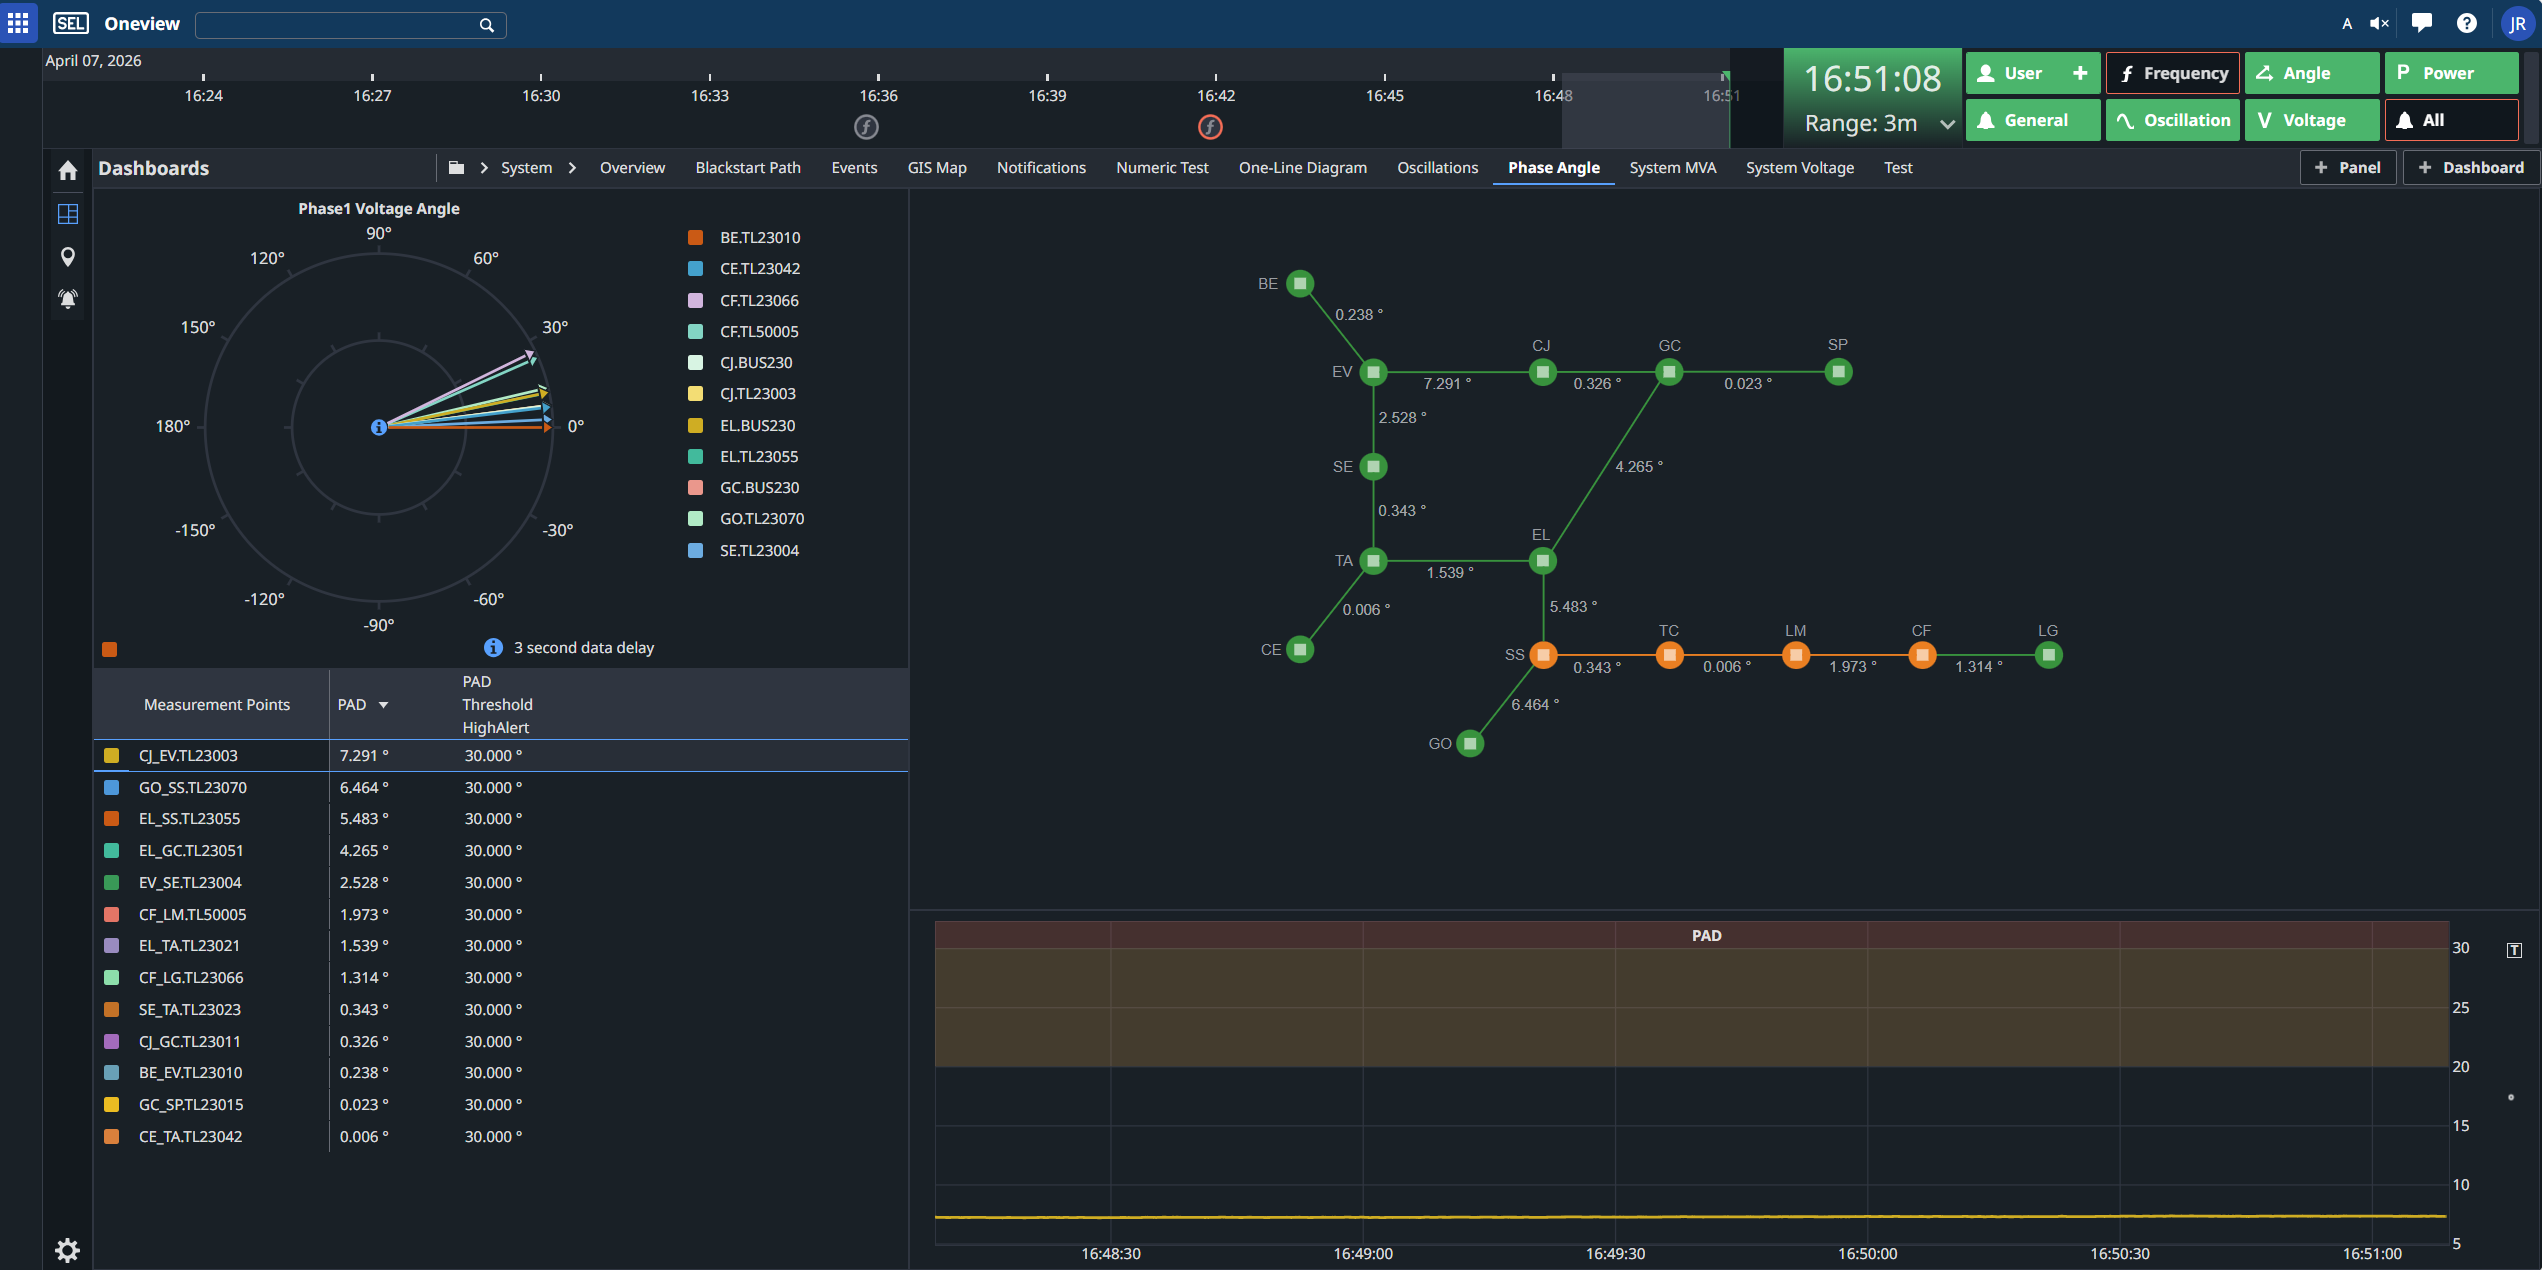
View real-time and historic phase angles across your system via a phase angle overview diagram. The phase angle monitor automatically computes the phase angle difference (PAD) across transmission lines and generates a notification when the PAD for a transmission line exceeds its limit.
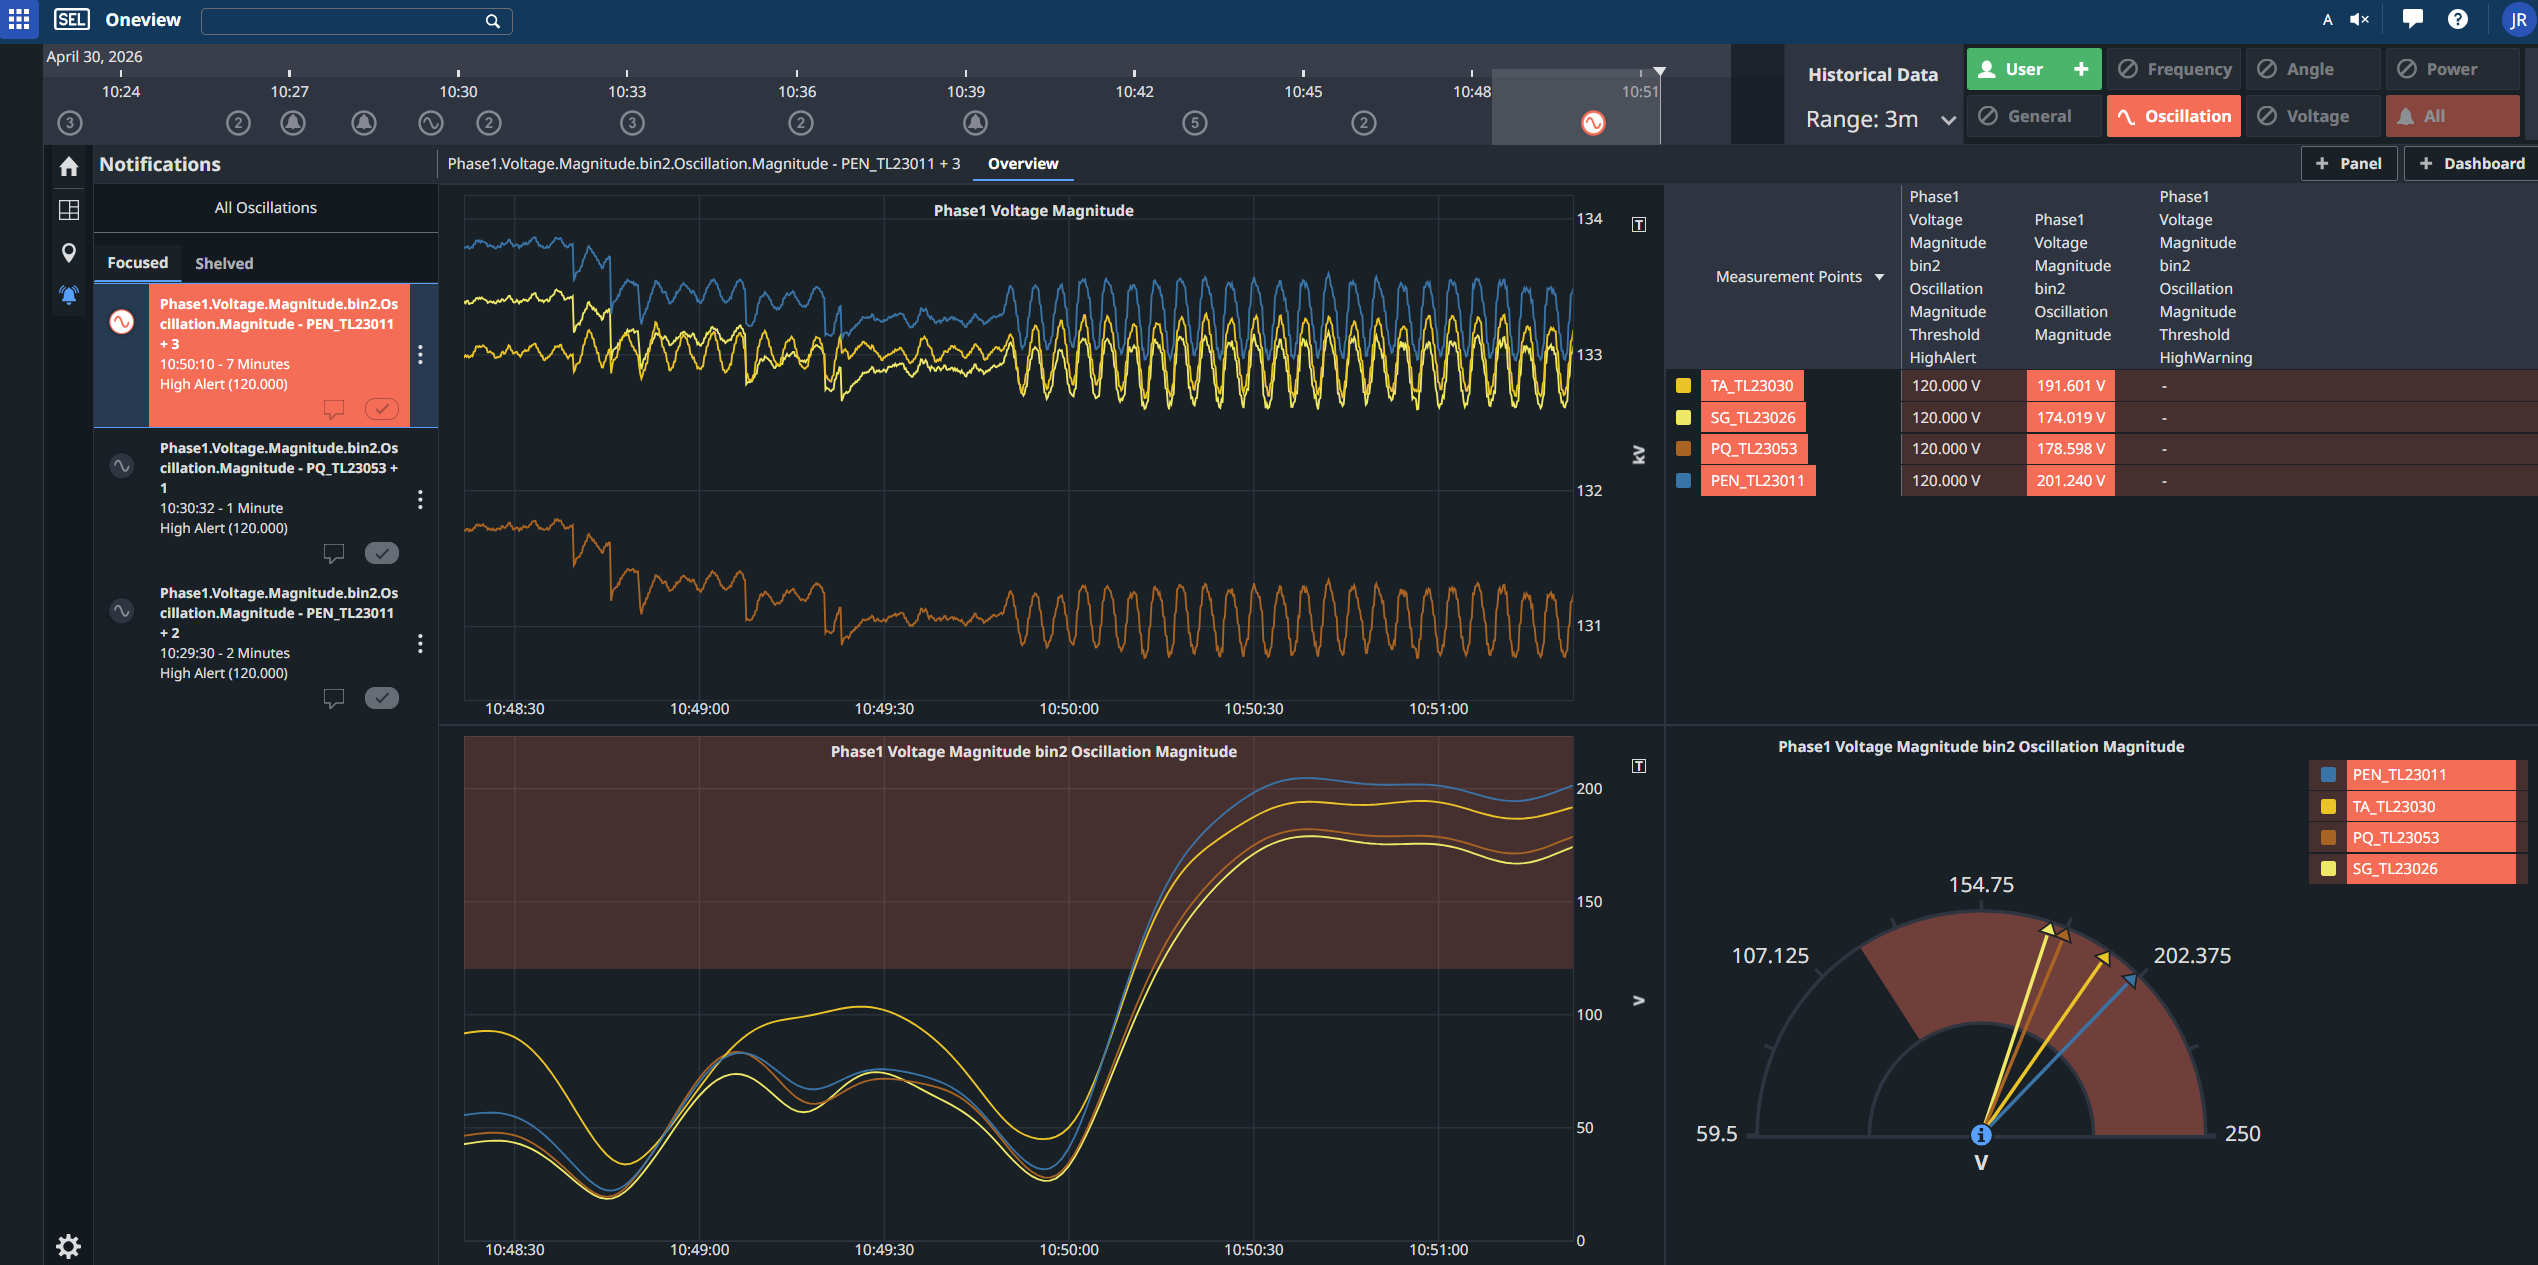
Oscillation Detection
Automatically identify oscillations, promptly notify relevant stakeholders, and facilitate easy, thorough investigation of events.